Flexural Bending Modes for a Thin Rectangular Bar
The animations on this page make use of the cividis colormap, which is supposed to be one of the best colormaps to enable someone with color blindness to visualize scientific data.Here is a link to a red-blue color version of the same animations.
- Jamie R. Nuñez, Christopher R. Anderton, and Ryan S. Renslow, "Optimizing colormaps with consideration for color vision deficiency to enable accurate interpretation of scientific data", PLOS ONE, (August 1, 2018), https://doi.org/10.1371/journal.pone.0199239
The animations on this page were created with COMSOL Multiphysics 6.2.
Thin Rectangular Bar Free At Both Ends (Free-Free)
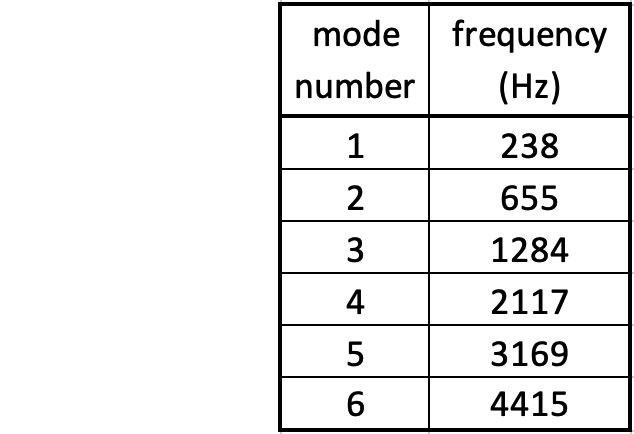
The animations below show the first five mode shapes for an Aluminum Bar (5 cm wide, 30 cm long, and 4 mm thick), free at both ends. The flexural fending frequencies for a thin bar free at both ends may be accurately approximated by $$ f = \frac{\pi}{8}\frac{h}{\sqrt{12}}\frac{1}{L^2}\sqrt{\frac{E}{\rho}}\;(2n+1)^2 $$ where \(h\) and \(L\) are the thickness and length of the bar, respectively and \(E\) is the Young's elastic modulus and \(\rho\) is the density. The frequencies depend on mode number \(n\) as \((2n+1)^2\) so that the frequencies are not integer multiples of a fundamental, as they are for longitudinal waves in a bar or transverse waves on a string.
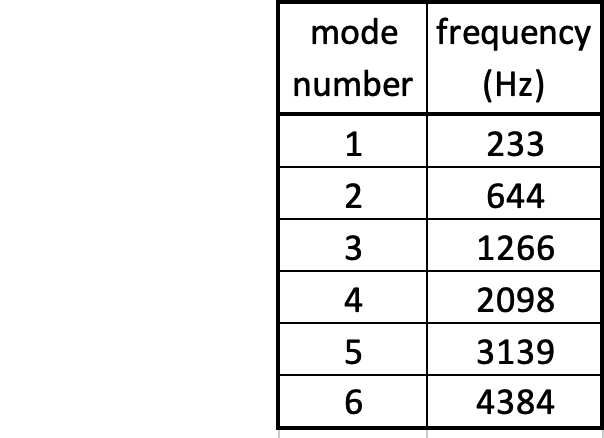
Thin Rectangular Bar Fixed At Both Ends (Fixed-Fixed)
The animations below show the first five mode shapes for an Aluminum Bar (5 cm wide, 30 cm long, and 4 mm thick), fixed at both ends. When using the Bernoulli-Euler approximate theory for flexural waves in a thin bar, the frequencies for a thin bar fixed at both ends are practically identical to those for a free-free bar with the same dimensions and material properties (equation given above). In reality, there are slight differences between the frequencies for the two boundary conditions, which become more divergent when the thickness increases.