Vibrational Analysis of a (cutlery) Fork
I have published four papers and couple of webpages about the vibration and radiation of sound from tuning forks. A couple of months ago, I found a simple looking cutlery fork (the kind you use for eating) when I was cleaning out my research lab space and I was curious to see if a cutlery fork would exhibit any vibrational modes where the tines moved in opposite or alternating directions.
Modal Analysis
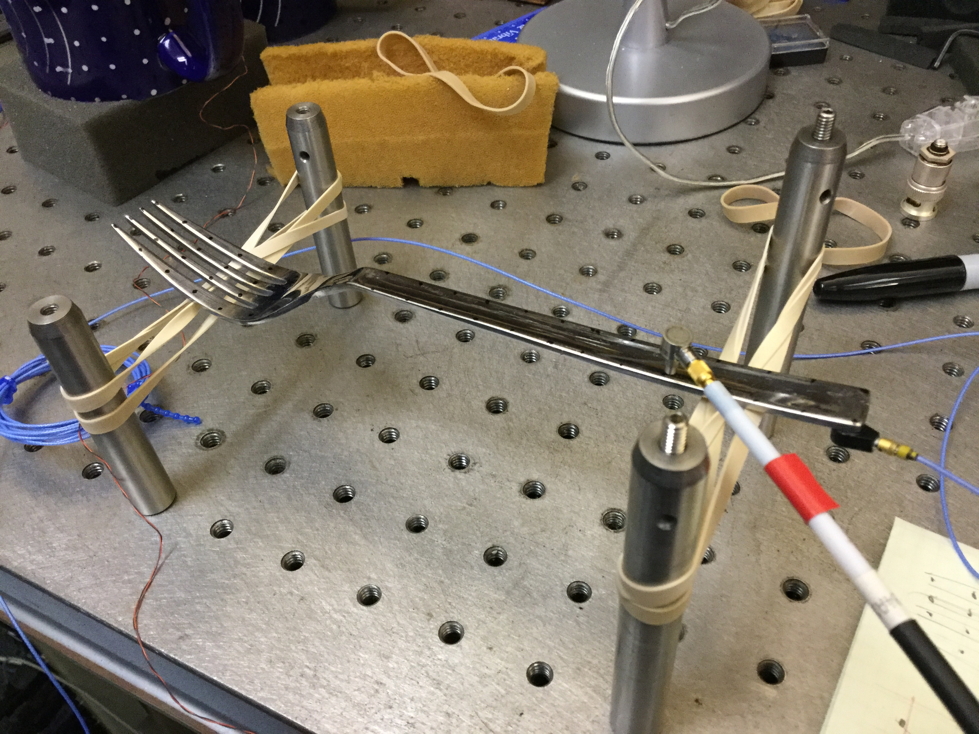
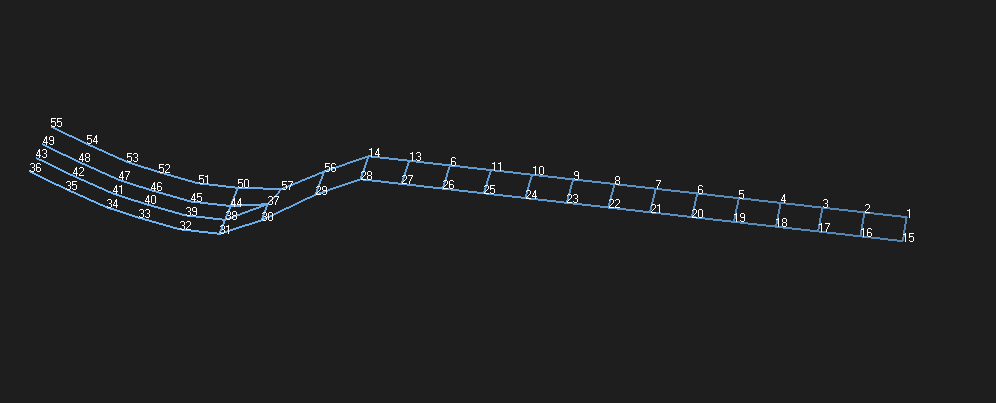
Experimental Modal Analysis is an experimental method that provides the vibrational mode shapes, their natural frequencies, and damping rates for a structure. A small (0.5g) accelerometer was attached underneath at the handle end of fork. A miniature impact force hammer was used to tap the fork at 1-cm intervals along the length of the fork. The ratio of acceleration to force (called the frequency response function) was recorded for each impact location. The collection of 57 frequency response functions was curve fit using STAR Modal software. The resulting relative amplitudes of motion corresponding to each measurement point were mapped to the grid point representation of the fork, resulting in shapes as shown further below.
Mode Shapes
The resulting shapes weren't as exciting as I had hoped - and I was not able to observe any modes below 25,600 Hz where the tines moved in opposite directions (at least for a freely supported fork). I guess I shouldn't have been surprised to discover that for forks behaves pretty much like a slightly non-uniform free-free beam.