Acoustics and Vibration Animations

Daniel A. Russell, Graduate Program in Acoustics, The Pennsylvania State University


Creative Commons License
This work by Dan Russell is licensed under a Creative Commons Attribution-NonCommercial-NoDerivatives 4.0 International License.
Based on a work at http://www.acs.psu.edu/drussell/demos.html.

The content of this page was originally posted on November 28, 2020.


Phase Between Displacement, Velocity, and Pressure
for Longitudinal Sine Waves

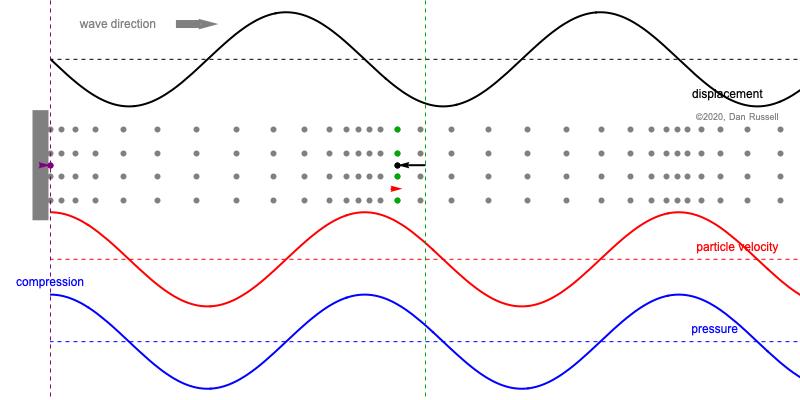
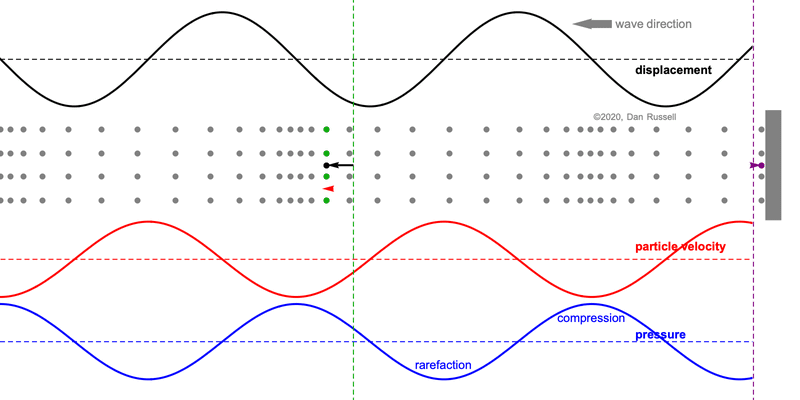
When discussing the behavior of longitudinal plane waves (i.e., sound waves air), the following statements are often made regarding the relative phase between the pressure and the fluid particle velocity[1]

Mathematically this is observed the presence of a negative sign for the left going part of the wave expression. But conceptually, this can be a bit tricky to understand, especially because we tend to draw plots of displacement, velocity using the vertical axis to indicate positive values for a wave which involves longitudinal (horizontal) motion.

If we start with an expression for pressure for a sinusoidal wave traveling in the positive \(x\)-direction, $$ p(x,t) = A e^{j(\omega t - k x)} \qquad \hbox{real part} \longrightarrow p(x,t) = A \cos(\omega t - k x) , $$ the particle velocity associated with this pressure is obtained through the conservation of momentum (Euler's equation) $$ \rho\frac{\partial u}{\partial t} = - \frac{\partial p}{\partial x} \quad \longrightarrow \quad u = - \frac{1}{\rho} \int \frac{\partial p}{\partial x}\, dt $$ so that the particle velocity for this sinusoidal wave traveling the positive \(x\)-direction is $$ u(x,t) = \frac{1}{\rho c} A e^{j(\omega t-kx)} \qquad \hbox{real part} \longrightarrow u(x,t) = \frac{1}{\rho c}A \cos(\omega t - k x) , $$ where I've made use of the fact that the wave speed \(c=\omega/k\). Comparing the expressions for particle velocity and pressure, we see that they are exactly the same except that velocity amplitude is smaller by a factor of \(\rho c\), a quantity which is called the "characteristic impedance" of the medium through which the wave is traveling.

Now let's consider a pressure wave traveling in the negative \(x\)-direction, $$ p(x,t) = B e^{j(\omega t + k x)} \qquad \hbox{real part} \longrightarrow p(x,t) = B \cos(\omega t + k x) . $$ As above, the particle velocity associated with this pressure is obtained through the conservation of momentum, so that the particle velocity for this sinusoidal wave traveling the negative \(x\)-direction is $$ u(x,t) = -\frac{1}{\rho c} B e^{j(\omega t + k x)} \qquad \hbox{real part} \longrightarrow u(x,t) = - \frac{1}{\rho c}B \cos(\omega t + k x) , $$ Comparing these expressions for particle velocity and pressure, we see that now the velocity amplitude is negative indicating a 180o phase relationship between velocity and pressure.


Right Going (Forward Traveling) Wave

This animation shows a sinusoidal longitudinal wave traveling in the positive (forward) direction, from left to right. The particle velocity and pressure are in-phase; maximum positive velocity (moving right) occurs when pressure is positive (compression).

animation showing particle motion for a longitudinal pressure wave
  • The gray dots represent the motion of particles in the medium, and as the wave travels from left to right, the particles oscillate back and forth horizontally about their equilibrium postions.
  • The black plot represents the horizontal displacement of the fluid particles from their equilibrium positions. A large positive vertical value for the displacement plot indicates a large positive horizontal displacement (to the right) from equilibrium. The vertical green dashed line indicates a reference equilibrium postion and the black arrow indicates the displacement of a fluid particle relative to this equilibrium point. The length and direction of this black arrow matches the displacement plot values at the green reference location.
  • The red arrow and plot represent the particle velocity. When the particles are moving to the right (in the positive direction), the velocity plot is positive and the arrow points to the right. When the particles are moving to the left (in the negative direction), the velocity plot is negative and the arrow points to the left.
  • The blue plot represents the pressure. The regions where the particles are closely packed together (labeled "compression") have a large positive pressure. Regions where the particles are spaced farther apart (labeled "rarefaction") have a negative pressure, compared to the ambient pressure when no wave is present.

Left Going (Backward Traveling) Wave

This animation shows a sinusoidal longitudinal wave traveling from right to left in the negative \(x\)-direction. The particle velocity and pressure are now opposite-phase; positive velocity (moving right) occurs when pressure is negative (rarefaction).
animation showing particle motion for a longitudinal pressure wave
  • The gray dots represent the motion of particles in the medium. As the wave travels from right to left, the particles oscillate back and forth horizontally about their equilibrium postions.
  • The black plot represents the horizontal displacement of the fluid particles from their equilibrium positions. A large positive vertical value for the displacement plot indicates a large positive horizontal displacement (to the right) from equilibrium. The vertical green dashed line indicates a reference equilibrium postion and the black arrow indicates the displacement of a fluid particle relative to this equilibrium point.
  • The red arrow and plot represent the particle velocity. When the particles are moving to the left (in the negative direction), the velocity plot is negative and the arrow points to the left. When the particles are moving to the right (in the positive direction), the velocity plot is positive and the arrow points to the right.
  • The blue plot represents the pressure. The regions where the particles are closely packed together (labeled "compression") have a large positive pressure. Regions where the particles are spaced farther apart (labeled "rarefaction") have a negative pressure, compared to the ambient pressure when no wave is present. But, now, the regions of compression (high positive pressure) are aligned with the regions where the particle velocity is negative (to the left).

We could summarize these two cases by stating that "the direction in which a wave is propagated is the direction of the particle velocity in the zone of compression."[2]


References

  1. David T. Blackstock, Fundamentals of Physical Acoustics (John Wiley & Sons, Inc., 2000), pg. 48.
  2. S. N. Rzhevkin, A Course of Lectures on The Theory of Sound (MacMillian, 1963), p. 28-31.