
The Forced Harmonic Oscillator
Transient response to an applied force
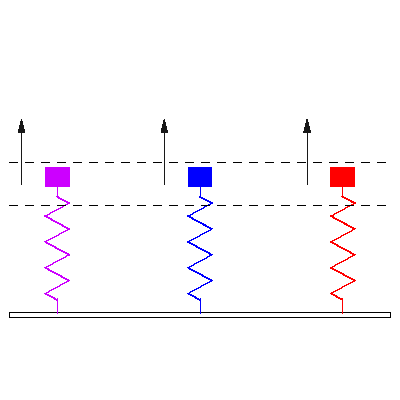
Three identical damped 1-DOF mass-spring oscillators, all with natural frequency \( f_o = 1 \) , are initially at rest. A time harmonic force \( F =F_o \cos(2 \pi f t) \) is applied to each of three damped 1-DOF mass-spring oscillators starting at time \( t<0 \). The driving frequencies of the applied forces are (matching colors in the animation from left to right) \[ {\color{purple} f=0.4 f_o } \qquad {\color{blue} f=1.01 f_o } \qquad {\color{red} f=1.6 f_o } \] The animation at left shows response of the masses to the applied forces. The direction and magnitude of the applied forces are indicated by the arrows. The dashed horizontal lines provide a reference to compare magnitudes of resulting steady state displacement.
Plots showing transition from transient to steady state motion
Mass 1: Below Resonance
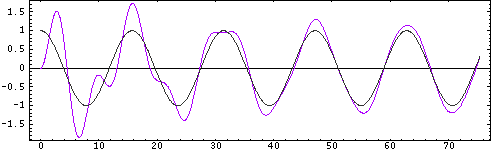
This first plot shows the displacement (as a function of time) for the first mass (purple, on the left) from the animation above. The forcing frequency is \( f=0.4 f_o \) so that the first oscillator is being driven below resonance. The grey curve shows the applied force (positive is upwards), and the purple curve shows the displacement of the mass in response to the applied force. After the transient motion decays and the oscillator settles into steady state motion, the displacement is in phase with force. Notice that the frequency of the steady state motion of the mass is the driving (forcing) frequency, not the natural frequency of the mass-spring system.
Mass 2: At Resonance
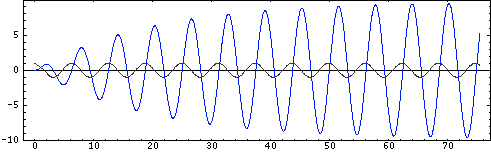
In this the forcing frequency is \( f=1.01 f_o \), so that the second oscillator is being driven very near resonance. The grey curve shows the applied force (positive is upwards), and the blue curve shows the displacement of the mass in response to the applied force. Since the oscillator is being driven near resonance the amplitude quickly grows to a maximum. After the transient motion decays and the oscillator settles into steady state motion, the displacement 90o out of phase with force (displacement lags the force). Notice, again, that the frequency of the steady state motion of the mass is the driving (forcing) frequency, not the natural frequency of the mass-spring system.
Mass 3: Above Resonance
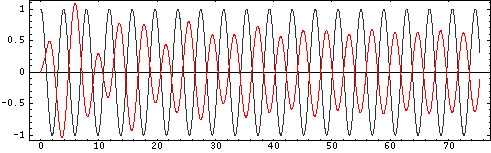
This third plot shows the displacement of the right-side mass from the animation above. The forcing frequency is \( f=1.6 f_o \), so that the third oscillator is being driven above resonance. The grey curve shows the applied force (positive is upwards), and the red curve shows the displacement of the mass in response to the applied force. Since the oscillator is being driven near resonance the amplitude quickly grows to a maximum. After the transient motion decays and the oscillator settles into steady state motion, the displacement 180° out of phase with force. Notice, again, that the frequency of the steady state motion of the mass is the driving (forcing) frequency, not the natural frequency of the mass-spring system. Also notice that the amplitude of motion is less than when the mass was driven below resonance.