Physics and Acoustics of Baseball & Softball Bats
Daniel A. Russell, Ph.D.
Science & Mathematics Department, Kettering University, Flint, MI 48504-4898
All images and text are ©2003-2004 Daniel A. Russell

The contents of this page were last modified on March 17, 2004

Measuring the Vibrational Behavior of a Baseball/Softball Bat

The experimental technique I use in the laboratory to measure the vibrational mode shapes, natural frequencies and damping parameters of baseball and softball bats is called Experimental Modal Analysis (EMA).[1-3] This is a technique which has a huge range of applications across many industries and is well documented in the literature, books, and even on the WWW. Essentially the collection of data involves applying an input force at a given point on a structure and recording the vibration response at another point on the same structure.

The bats are suspended at the barrel and handle ends using rubberands. This provides some stability so the bats won't bounce around during testing, but doesn't prevent the bats from vibrating. I use a special impact hammer to provide the input force - the hammer has a force transducer in the head so as to measure time history of the force impulse when the hammer stikes the test object (baseball bat). I measure the vibration response of the bat with a very small (1.0 gram) accelerometer. I typically attach the accelerometer on the barrel about 9 inches from the end - for most bats this allows me to find the first five bending and first three hoop modes. I tap the bat at 1-inch intervals along the length, keeping the accelerometer fixed, thus collecting a measurement of force input acceleration response for every pair of points along the length of the bat.

The electrical signals from the hammer and accelerometer are fed into a 2-channel frequency analyser, where they are converted (transformed) from time signals (amplitude versus time) into frequency spectra (amplitude versus frequency). The frequency response from the accelerometer is divided by the frequency response of hammer impact resulting in what is called the Frequency Response Function (FRF) for the impact. Each FRF record is saved for post-processing with special computer software to produce the cool animations of the vibrating mode shapes. However, with some experience comparing FRF data for a couple of different impact locations one can quickly identify the frequencies for the different types of vibrational patterns a bat exhibits.


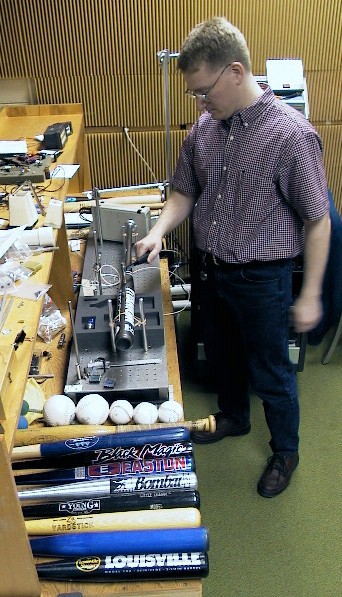
Fig. 1. Equipment setup for experimental modal analysis.


Fig. 2. Frequency analyzer displaying a Frequency Response Function (FRF).

Figure 3 compares Frequency Response Functions for three impact locations. The left plot shows the FRF recorded for an impact near the barrel end with the accelerometer about 9 inches in on the barrel. Each peak in the FRF represents one of the vibrational modes of the bat - the first four bending and first two hoop modes are identified. The middle plot shows the FRF recorded for an impact near the sweet spot of the bat, about 7 inches from the end. Now the first bending mode (B1) is absent from the FRF because this mode shape has a node (zero displacement point) at this location so an impact here will not excite it. The right plot shows the FRF recorded for an impact at the knob on the handle. While the four bending modes are present in the FRF, the two hoop modes (H1 and H2) are missing. This is because the hoop modes only involve a vibration of the barrel of the bat, not the handle.

Fig. 3. Comparing FRF results for three impact locations allows for identification of bending and hoop modes.

When measuring the vibration of a baseball or softball bat, I typically make a FRF measurement every inch along the length of the bat (35 measurements for a 34" bat). Once all of the FRFs have been collected the data is post-processed on a PC using a commercial modal analysis softward package - we use STAR Modal in the Acoustics Laboratory ay Kettering University. The post processing involves curve fitting the peaks of the Frequency Response Functions in order to extract the mode shapes and frequencies. The result of the post processing is a collection of mode shapes, one for each of the resonance frequency peaks in the various FRF plots. Each mode shape shows how each location on the bat moves relative to every other location. The animations below show the raw mode shapes obtained after postprocessing using STAR Modal, along with animations of the mode shapes after the raw data was mapped to the actual profile of the bat. To see what the complete set of vibrational mode shapes looks like, go to Vibrational Behavior of a Baseball/Softball Bat.


Raw mode shapes for the first two bending modes of a 34" softball bat, obtained after post processing FRF data.


Animations of the first two bending modes for the same softball bat obtained by mapping raw mode shape data to the physical profile of the bat.

References

[1] P. Avitabile, "Experimental Modal Analysis: A Simple Non-Mathematical Presentation," Sound and Vibration, 35(1), 20-31 (2001)
[2] B.J. Schwarz and M.H. Richardson, "Experimental Modal Analysis," CSI Reliability Week, Orlando, FL, (1999)
[3] D.J. Ewins, Modal Testing: Theory and Practice, (Research Studies Press, 1988)

Back to Physics and Acoustics of Baseball & Softball Bats

That's me testing a bat in the Acoustics Laboratory at Kettering University, ca 2005.