
Regions of Resonance
Displacement Response of a Driven, Damped Oscillator
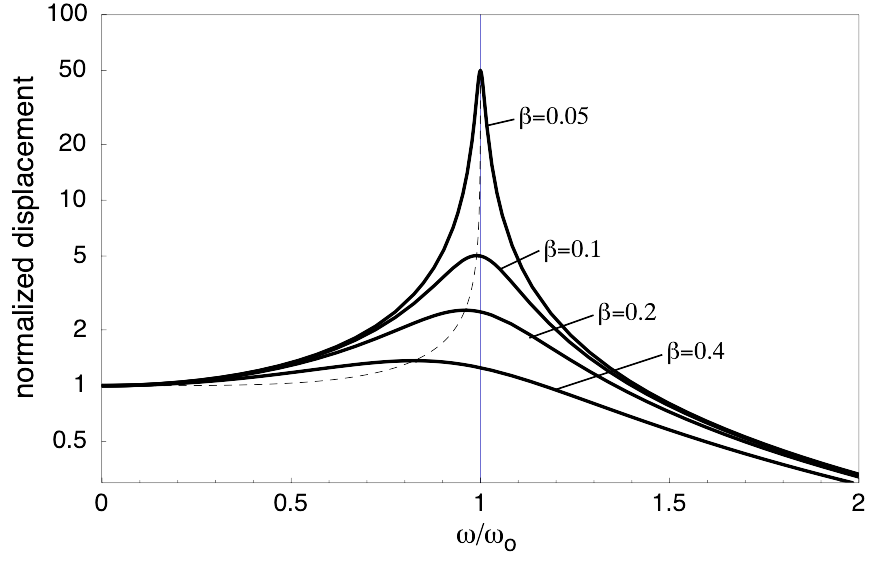 The displacement response of a driven, damped mass-spring system is given by
$$ x = {F_o / m \over \sqrt{(\omega^2-\omega_o^2)^2 + (2 \beta \omega)^2}} \ . $$
In this equation \( \omega_o \) represents the undamped natural frequency of the system, (which in turn depends on the mass, \( m\), and stiffness, \( s \)), and \(\beta\) represents the damping rate (which depends on the amount of mechanical damping, \( R \)).
$$ \omega_o = \sqrt{ s \over m} \qquad \hbox{ and } \qquad \beta = {R \over 2 m} \ $$
The displacement response of a driven, damped mass-spring system is given by
$$ x = {F_o / m \over \sqrt{(\omega^2-\omega_o^2)^2 + (2 \beta \omega)^2}} \ . $$
In this equation \( \omega_o \) represents the undamped natural frequency of the system, (which in turn depends on the mass, \( m\), and stiffness, \( s \)), and \(\beta\) represents the damping rate (which depends on the amount of mechanical damping, \( R \)).
$$ \omega_o = \sqrt{ s \over m} \qquad \hbox{ and } \qquad \beta = {R \over 2 m} \ $$
- When the driving frequency is very low (at the left side of the plot) the displacement levels off to the static displacement. This region of the plot is said to be stiffness-controlled, since the spring stiffness determines the value of the static displacement.
- When the driving frequency is very high (at the right side of the plot) the displacement drops to zero; the frequency is so high that by the time the mass begins to react to the driving force, the direction of the force has already changed to the opposite direction and the inertia of the mass essentially prevents it from oscillating. This region fo the plot is said to be mass-controlled because the inertia of the system limits its motion.
- In the middle of the plot, when the driving frequency is close to the undamped natural frequency \( \omega_O \), the displacement amplitude depends very strongly on the amount of damping present. This region of the plot is called the damping-controlled region.
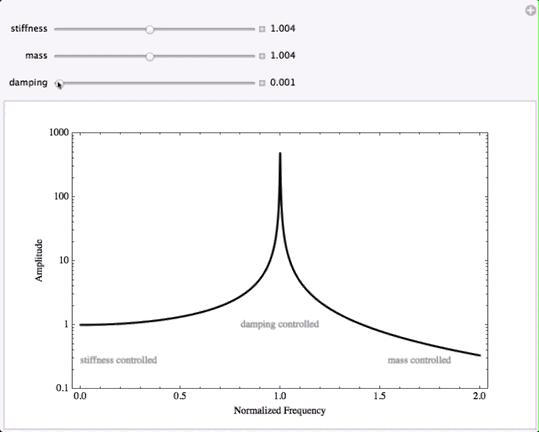
Stiffness-Controlled, Mass-Controlled, Damping-Controlled
The animation below shows how the displacement response of a forced mass-spring system changes when the values of the damping, stiffness, and mass are varied. First the damping is changed, then the stiffness, and then the mass -- watch what happens to the plot of displacement response as each quantity is varied.
When the damping rate is changed, the peak (or maximum) displacement changes; larger damping results in a lower maximum displacement. However, changing the damping only affects the displacement response in the damping-controlled region at the peak. Changing the damping does nothing at all to the displacement amplitude at lower or higher frequencies. This is important because it is often assumed that the best way to reduce unwanted vibration is to increase the damping in the system. However, adding damping to a system will not have any effect whatsoever if the driving frequency is well above or well below the resonance frequency of the system.
For driving frequencies well below resonance, when the system is being driven in the stiffness-controlled region, the only way to change the displacement is to change the stiffness of the system. Decreasing the stiffness will increase the amplitude of the low-frequency response, and increasing the stiffness will decrease the displacement amplitude in this region. So, if you need to reduce the displacement amplitude of a vibrating system at a frequency well below resonance, the only way to do this is to increase the stiffness. Notice that changing the stiffness does change the location of the resonance peak, but stiffness has no effect on the amplitude at very large frequencies.
Finally, at high frequencies where the driving frequency is well above resonance, the only way to change the displacement amplitude in this region is to change the mass of system. Increasing the mass will reduce the amplitude, and decreasing the mass causes the amplitude to increase. Changing the mass moves the resonance peak, but mass has no effect on the displacement response at very low frequencies.
Downloading and Using the Interactive Plot
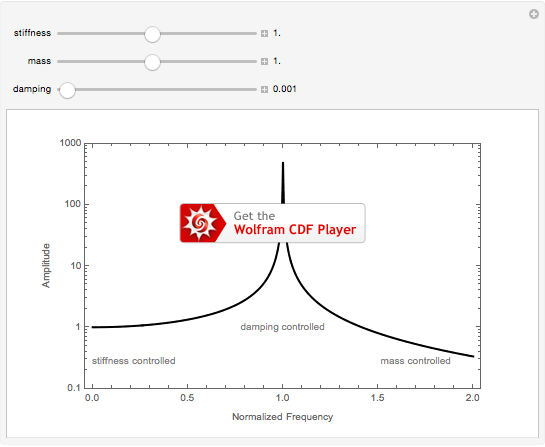
If you would like to download this interactive plot so that you can move the sliders yourself to see how the plot changes, you can download the file by clicking on the image at left. NOTE: This interactive plot file is a Computable Document Format (CDF) object created by Mathematica and you will need to install the free Wolfram CDF Player to be able to see it and interact with it. Unfortunately, the CDF player is not yet available for mobile devices. Once you have downloaded the CDF file, you can adjust the values of the mass, stiffness, and damping by moving the three sliders. If you click on one of the [+] buttons at the right of each slider, you can see the actual numerical value for that variable. You can then use the "-" and "+" buttons to decrease or increase the value in discrete steps. You should be able to type in a number into the text box (and hit the [return] key) though this may not work well on some web-browsers. The "play" button will animate the plot as a movie.