Pressure and Particle Displacement Upon Reflection
During the 19 years that I have been teaching undergraduate and graduate acoustics courses, I have found that the reflection of longitudinal pressure sound waves from hard and soft boundaries (i.e., rigid and open ends of pipes) can be a rather difficult concept for students to visualize. Elsewhere on my website I have posted animations showing:
In his web article I want to explore the relationship between pressure and particle displacement during the reflection of longitudinal sound waves from hard and soft boundaries.The Propagation of a Gaussian Displacement Pulse
Let's start by observing the motion of the particles in a molecular medium as a transient disturbance propagates from left to right down a pipe. In the animation below, a piston (the red line at the left) displaces to the right and then back to its equilibrium position. As a result of this piston movement, the particles immediately to the right of the piston are displaced from their equilibrium positions. The elastic properties of the medium causes the neighboring particles to be displaced also, and this chain reaction carries the disturbance down the length of the pipe as the wave pulse propagates. After the pulse has passed by, each particle in the medium returns to its equilibrium position.
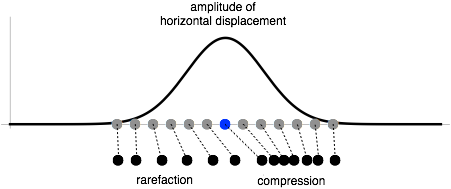
The wave pulse in the animation above is mathematically described by a Gaussian function, \(\xi(x,t)= \xi_o\,e^{(\omega t - kx)^2} \). Interpreting the nature of this wave pulse and the relationship between particle displacement and pressure may be aided by discussing what the Gaussian displacement function looks like, and what its shape means regarding the longitudinal displacement of the particles in the medium. The plot shown above at right shows the shape of the Gaussian pulse, with the vertical height of the plot representing the amplitude of longitudinal displacement in the positive x direction (i.e., to the right). The light gray dots underneath represent the equilibrium positions of the particles in the medium, and I've placed a blue dot at the center of the Gaussian function. The black dots below, and the dashed lines connected to the gray dots, represent the longitudinal displacement (to the right, in the positive x-direction) of each particle in accordance with the height of the Gaussian function. As can be seen fromt his interpretation, the particles on the leading edge of the pulse are bunched together (compression) indicating that the pressure is higher along the leading edge. In contrast, the particles on the trailing edge of the pulse are further apart (rarefaction), indicating that the pressure would be lower along the trailing edge.
Reflection from a Rigid (Fixed, or Closed) Boundary
Particle displacement and velocity are both inverted upon reflection from a rigid boundary, while pressure reflects upright.
Reflection from a Free (Open or Pressure Release) Boundary
Particle displacement and velocity both reflect upright from a free boundary (open end), while pressure is inverted upon reflection.