Modal Analysis of an Electric Guitar
Dr. Dan Russell and
Paul Pedersen
Applied Physics,
Kettering University
Modal Analysis of an Electric Guitar
Dr. Dan Russell and
Paul Pedersen
Applied Physics,
Kettering University
Modal Analysis of an Electric Guitar
Dr. Dan Russell and
Paul Pedersen
Applied Physics,
Kettering University
Modal Analysis of an Electric Guitar
Dr. Dan Russell and
Paul Pedersen
Applied Physics,
Kettering University

 The guitar used for this experiment is an Epiphone Coronet electric guitar. This guitar (in addition to an Epiphone amplifier, an ES-335 hollowbody electric, a 1960's Hummingbird acoustic, and two Slingerland drums) was donated to Kettering University by Gibson Musical Instruments Inc for student research projects such as this. The Coronet's body is made of hard maple and our guitar is painted metallic blue. There is a single pickup near the fret board and a humbucker pickup near the bridge. The strings were left attached during the experiment, and the guitar was tuned to its playing frequencies: E2 (82 Hz), A2 (110 Hz), D3 (147 Hz), G3 (196 Hz), B3 (247 Hz), and E4 (330 Hz).
Collecting the Data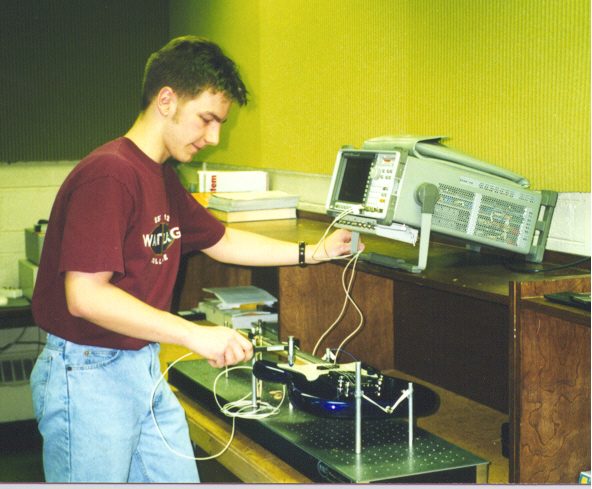
|
|
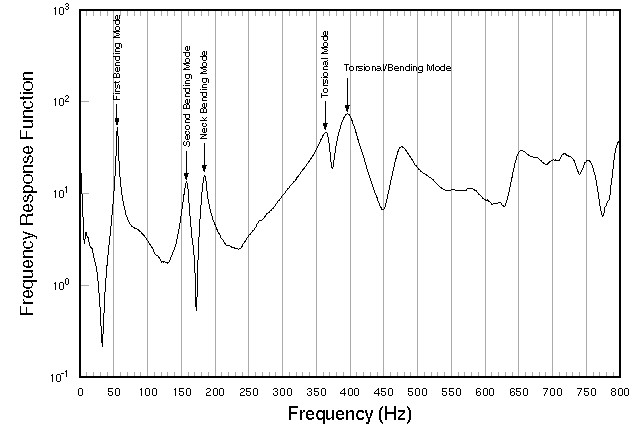
Here's an example of a frequency response function (with peaks identified according to the specific mode shapes we found after post processing).
|
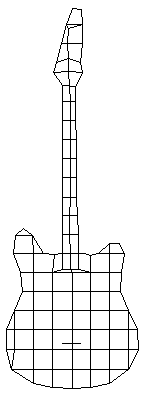
Post-Processing the Data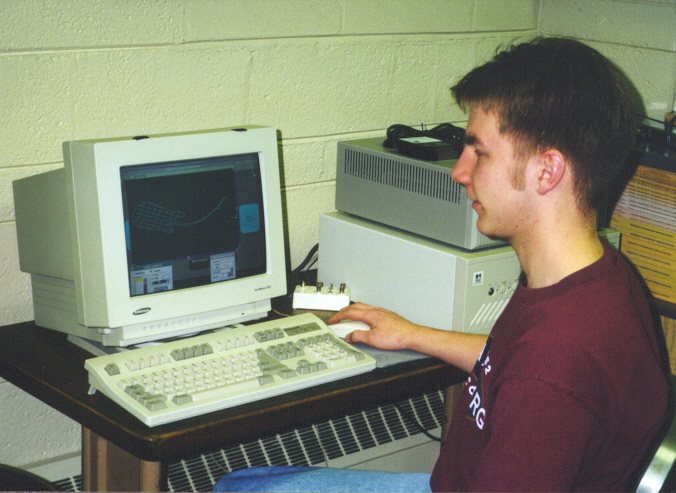 Post processing of the frequency response functions was performed using the modal analysis software STAR Modal from Spectral Dynamics. By looking at the frequency response functions we were able to identify at least 5 prominent peaks which represented modes of vibration. We placed a narrow frequency band around each peak and used a quadrature fit to curve fit the data. We have found that polynomial fits provide slightly more accurate frequency information, but that quadrature fits provide better looking (cleaner) mode shapes. After the computer had finished processing the data we were able to view animations of the five mode shapes we had identified. Post processing of the frequency response functions was performed using the modal analysis software STAR Modal from Spectral Dynamics. By looking at the frequency response functions we were able to identify at least 5 prominent peaks which represented modes of vibration. We placed a narrow frequency band around each peak and used a quadrature fit to curve fit the data. We have found that polynomial fits provide slightly more accurate frequency information, but that quadrature fits provide better looking (cleaner) mode shapes. After the computer had finished processing the data we were able to view animations of the five mode shapes we had identified.
|
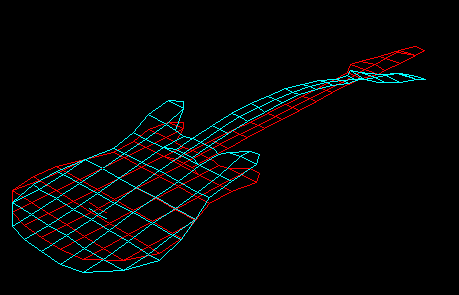 |
Mode #1 The first mode of vibration occurs at 55 Hz, and appears to be a simple bending mode. The entire guitar behaves much like a free-free beam vibrating in its fundamental mode. There are two nodal lines (places where the guitar does not move) - one is near the free end of the neck, and the other is close to the middle of the body. |
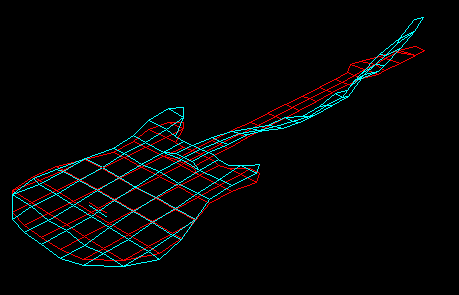 |
Mode #2 The second mode of vibration occurs at 160 Hz, and looks like the second free-free bending mode. Again there is a close similarity to the second mode of a free-free beam. |
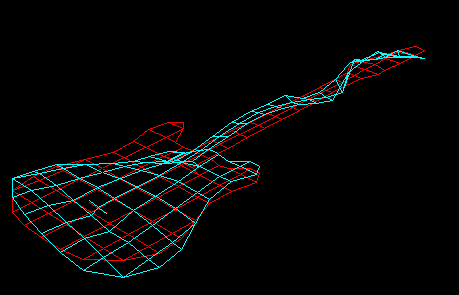 |
Mode #3 A torsional mode occurs at 372 Hz Hz, and is a torsional mode. This is most clearly seen in the vibration of the body - opposite corners move together in phase as if the body were twisting. Nodal lines roughly split the body into four equal parts. The neck exhibits both bending and twisting motions |
 |
Mode #4 At 472 Hz there is a bending mode in which the body of the guitar bends along its width. Then neck also bends along its length. |
Back to Dr. Russell's Guitar Research Page