
Non-Wood Bats: Performance Trends in College Baseball
In my article "Why Aluminum Bats Perform Better than Wood Bats I discuss experimental data which shows exactly how much faster some aluminum baseball bats can hit balls compared to wood bats. I also discuss several reasons why aluminum bats outperform wood bats. The controversy over whether or not aluminum bats should be banned for all levels of baseball (including high school and college) has been a hotly debated issue ever since aluminum bats were first allowed in college baseball back in 1974. Concerns over the safety of players - especially pitchers and infielders - and a perceived imbalance between offense and defense are the driving issues behind efforts to ban aluminum bats. Others prefer the "crack" of a wood bat to the annoying "ping" of a metal bat. Regardless of the various viewpoints and opinions which abound, I think it is safe to say that aluminum baseball bats are going to be a part of the game of amateur baseball for a long time to come.
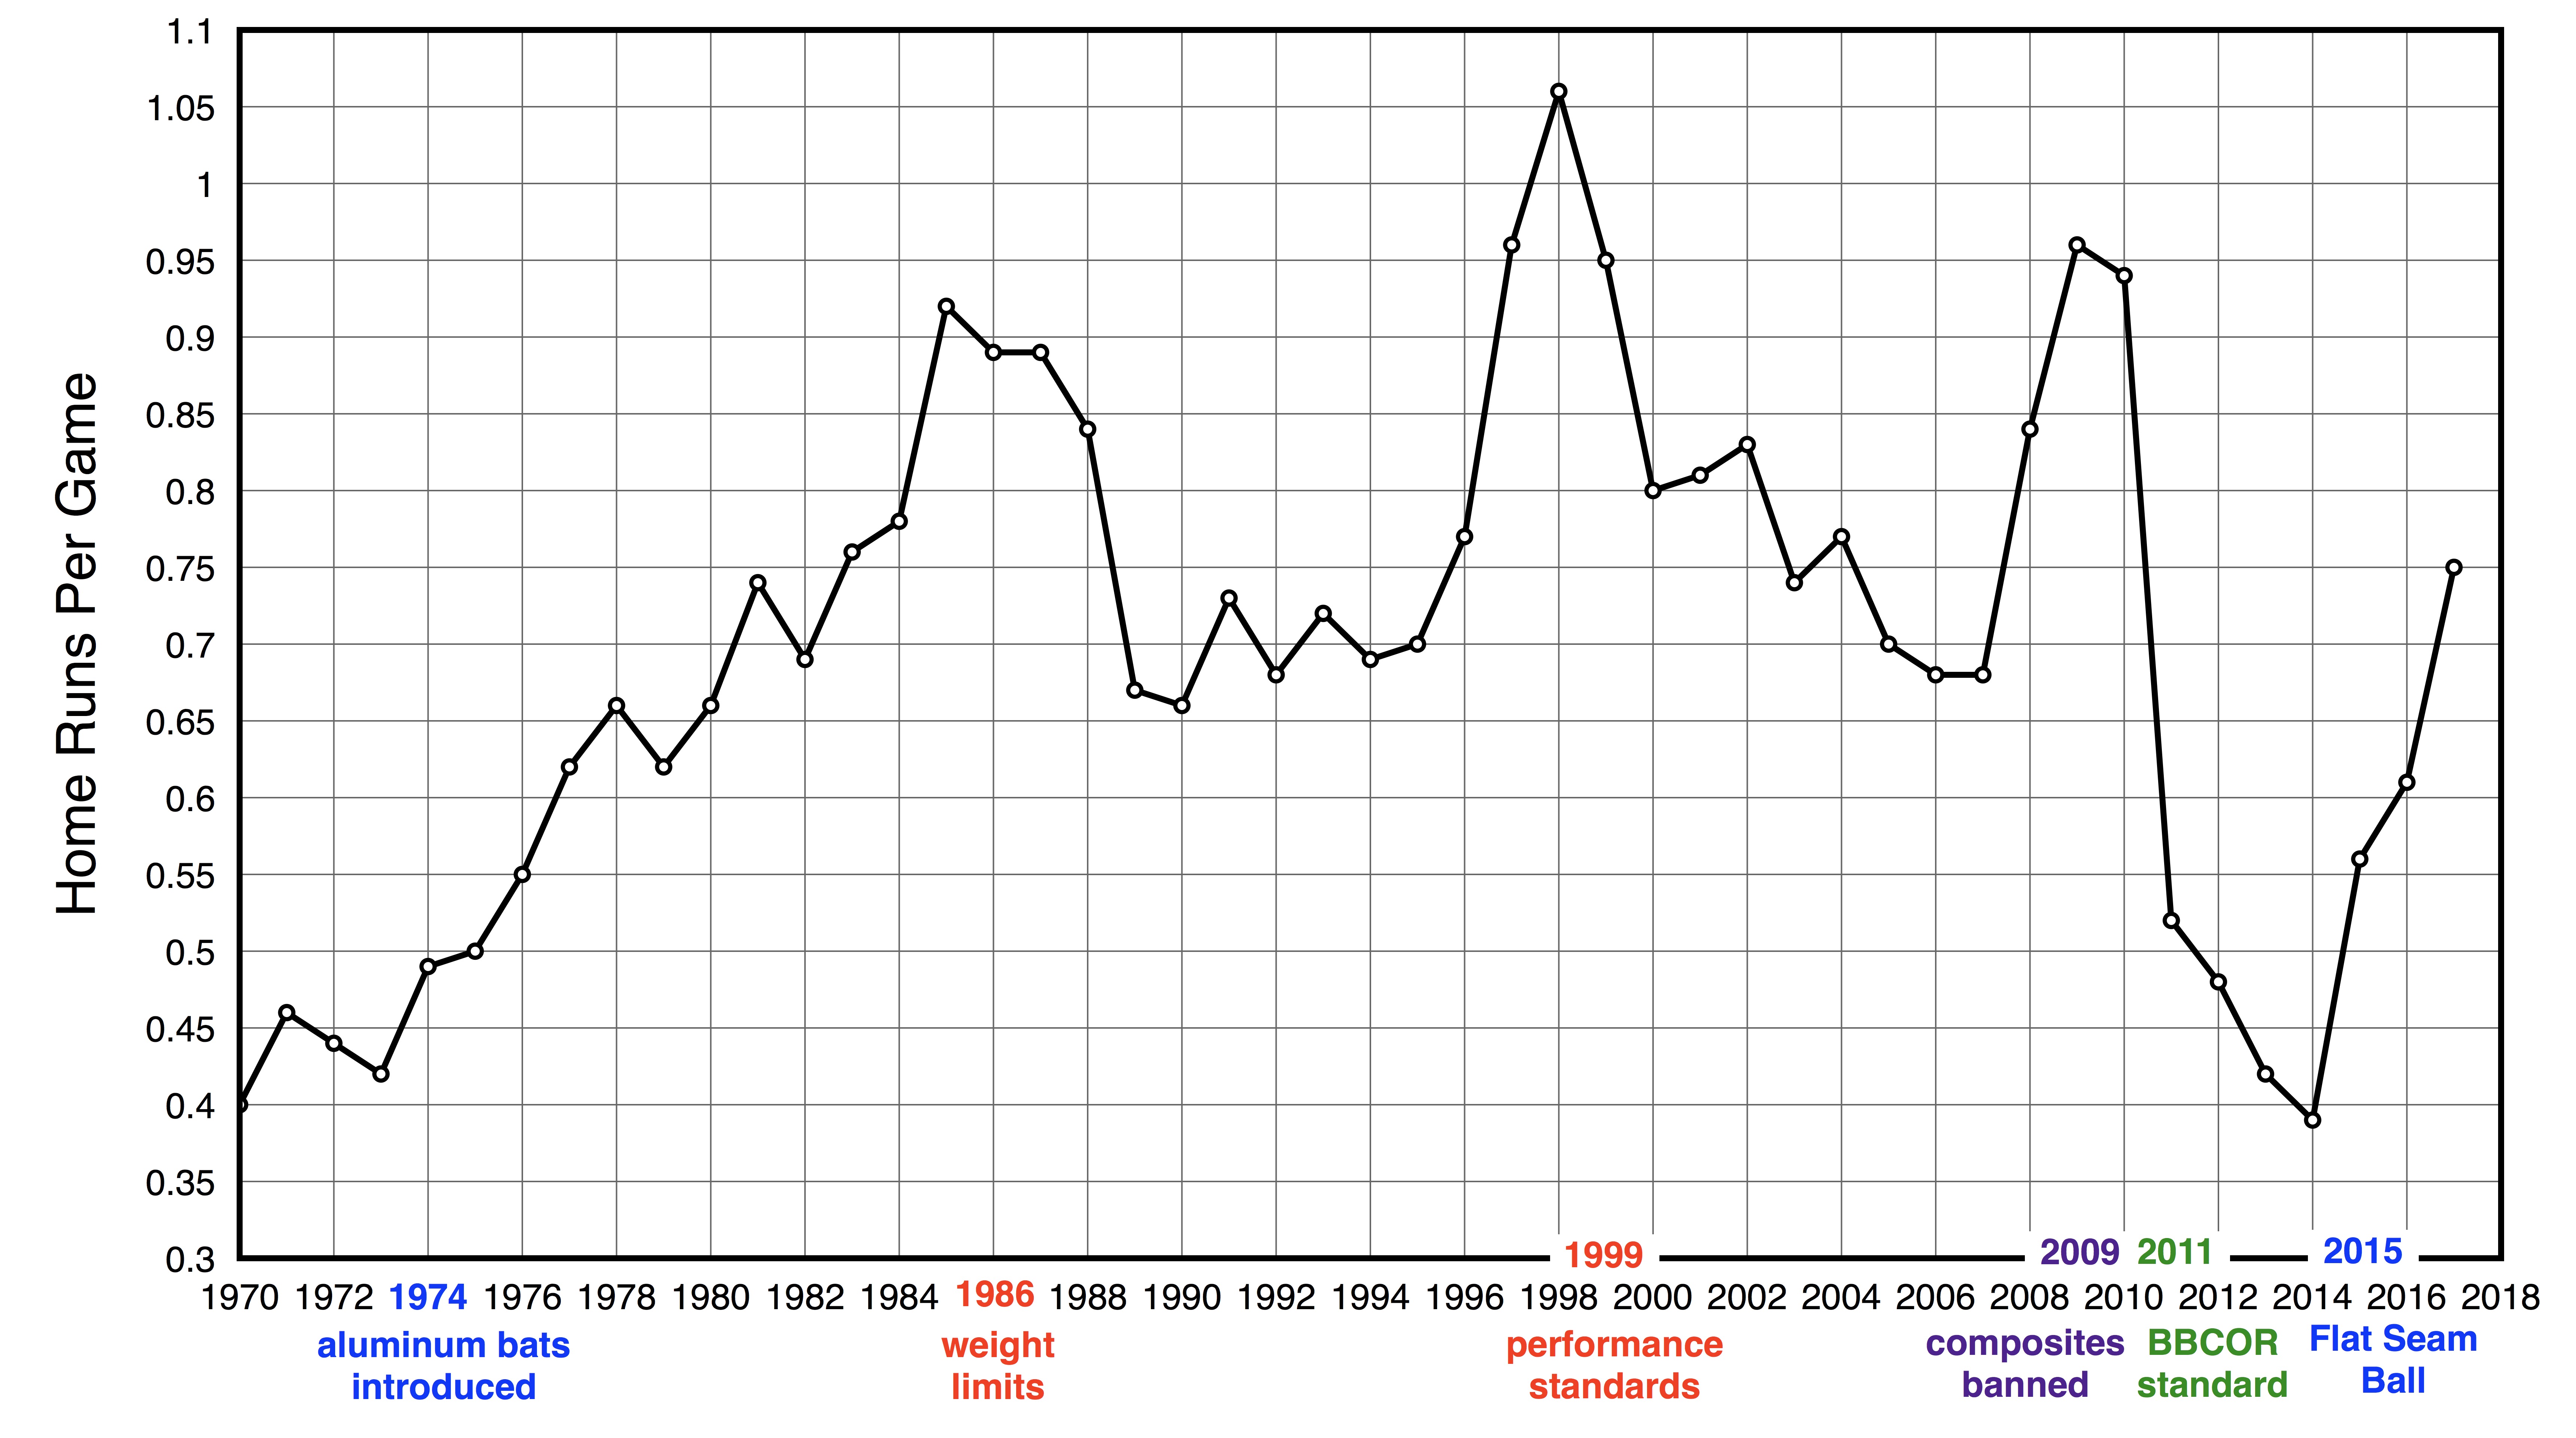
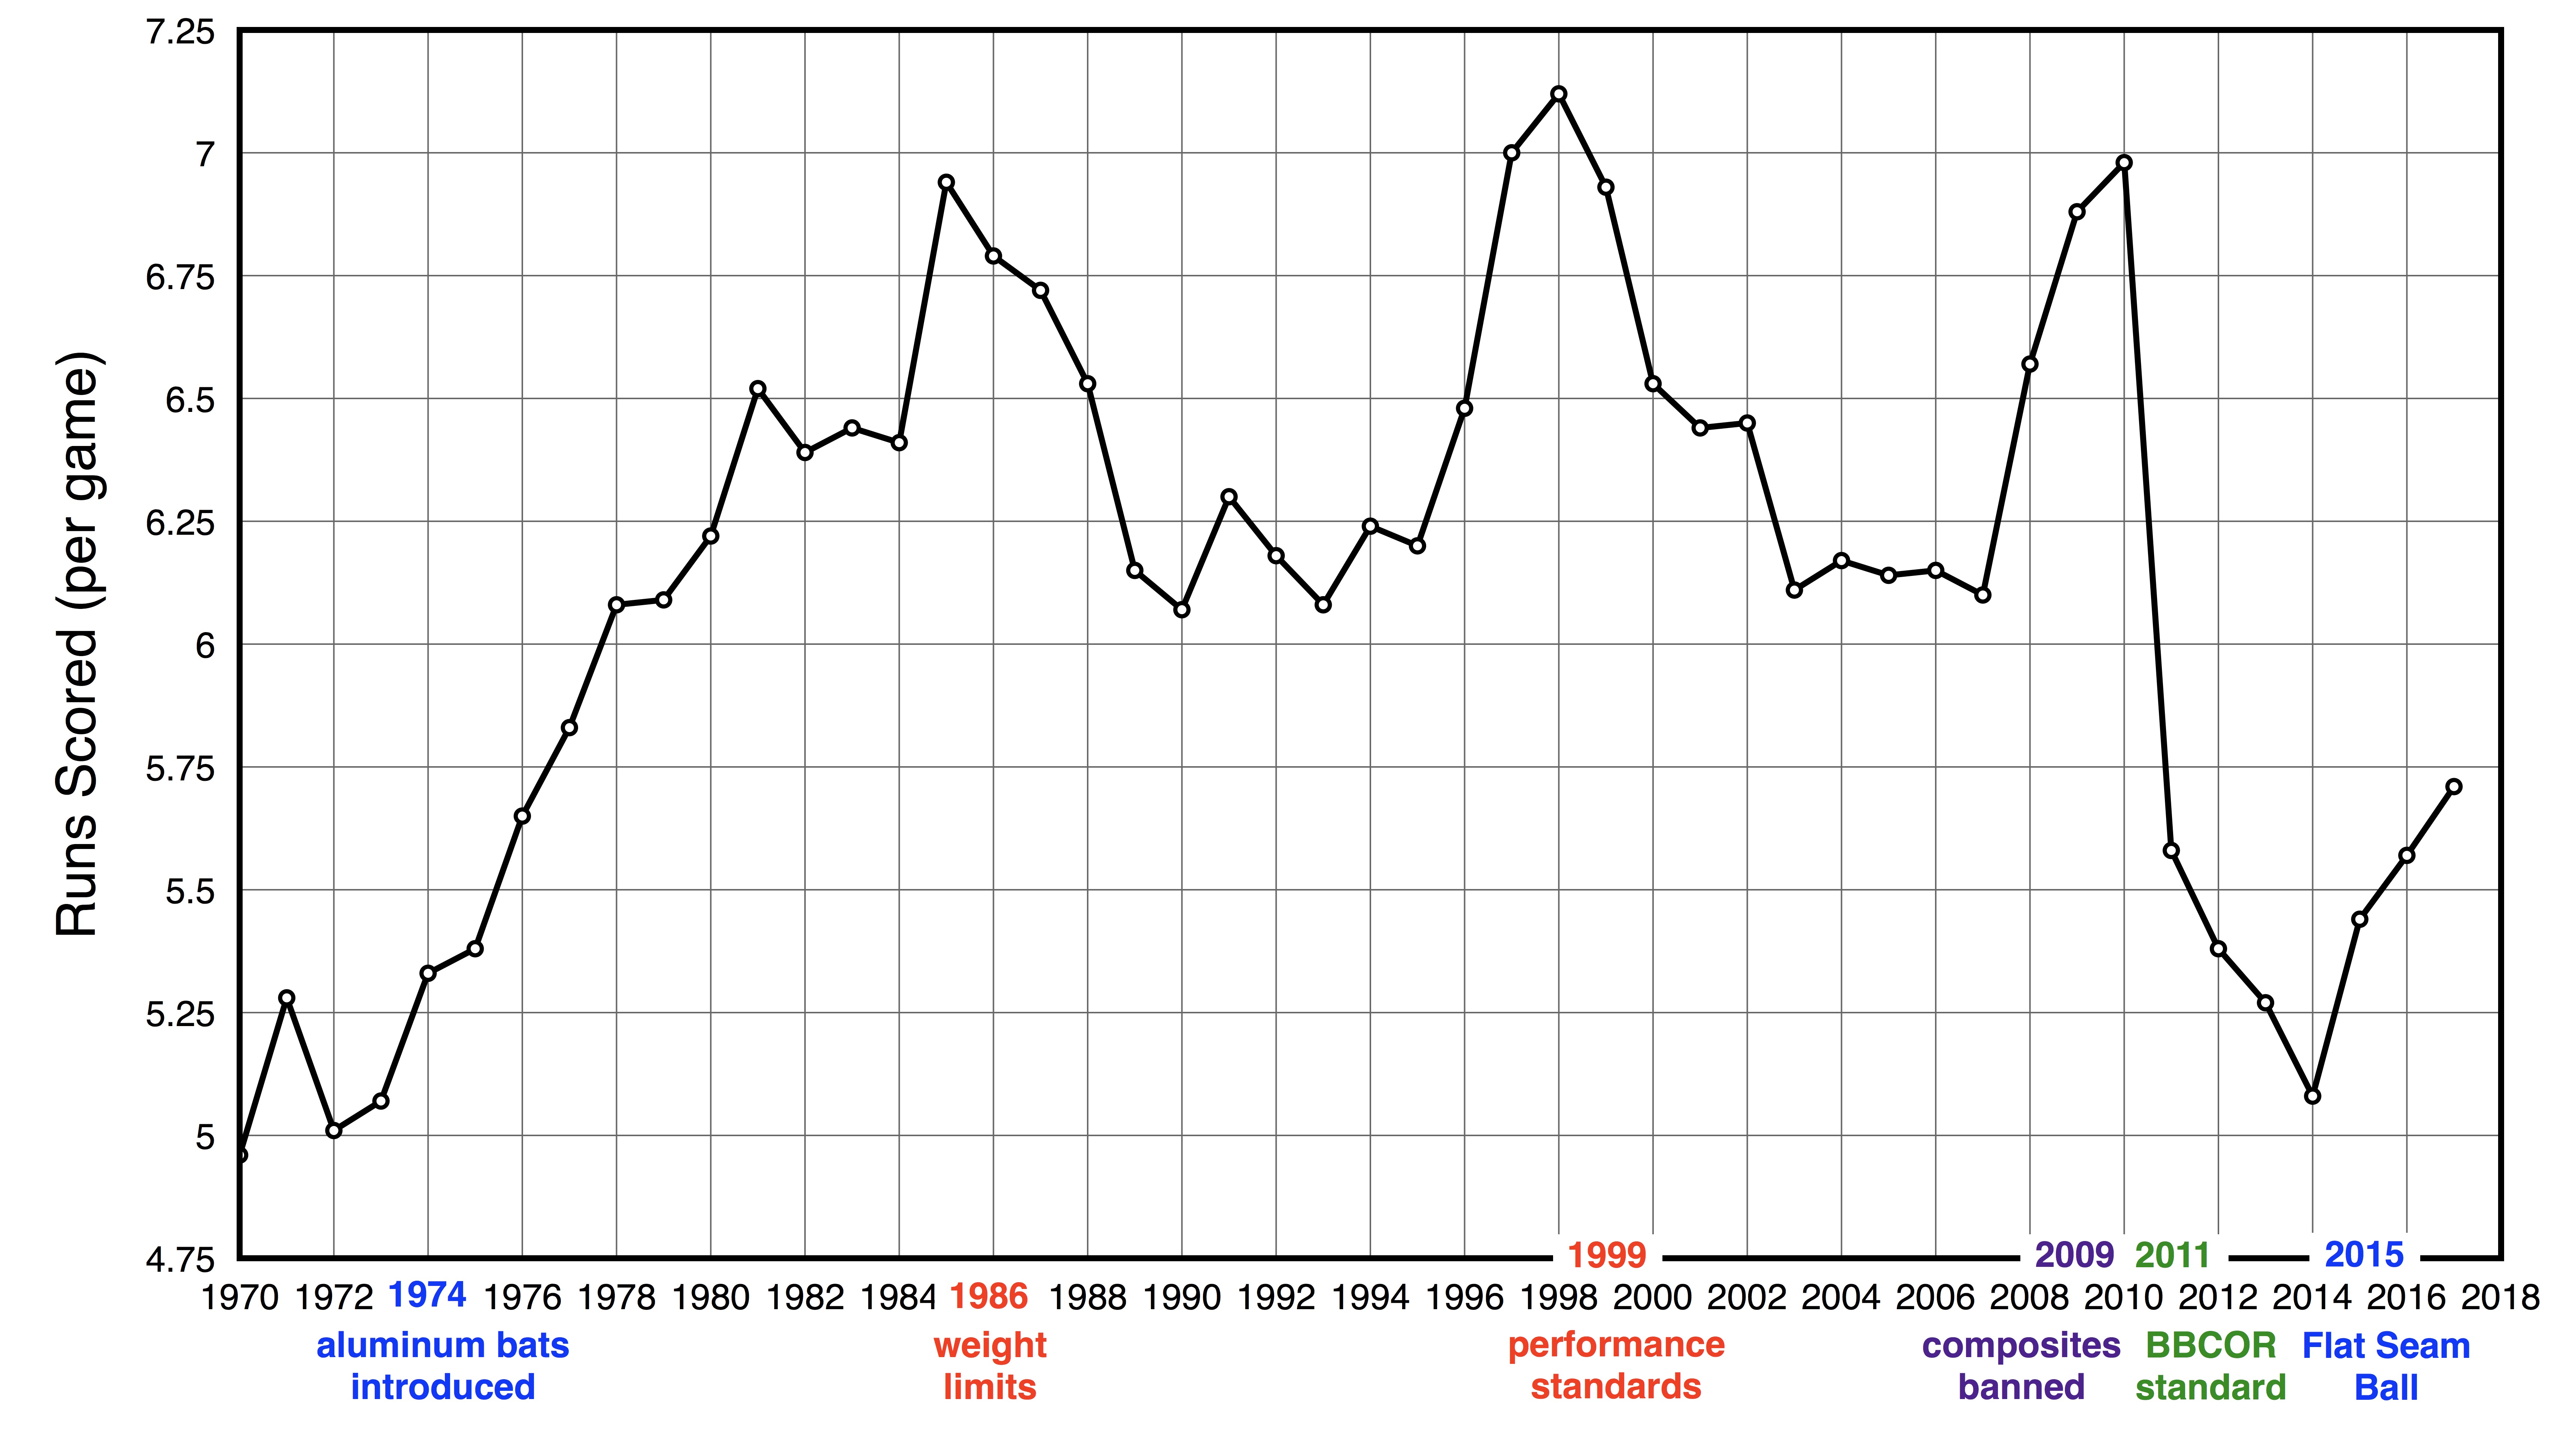
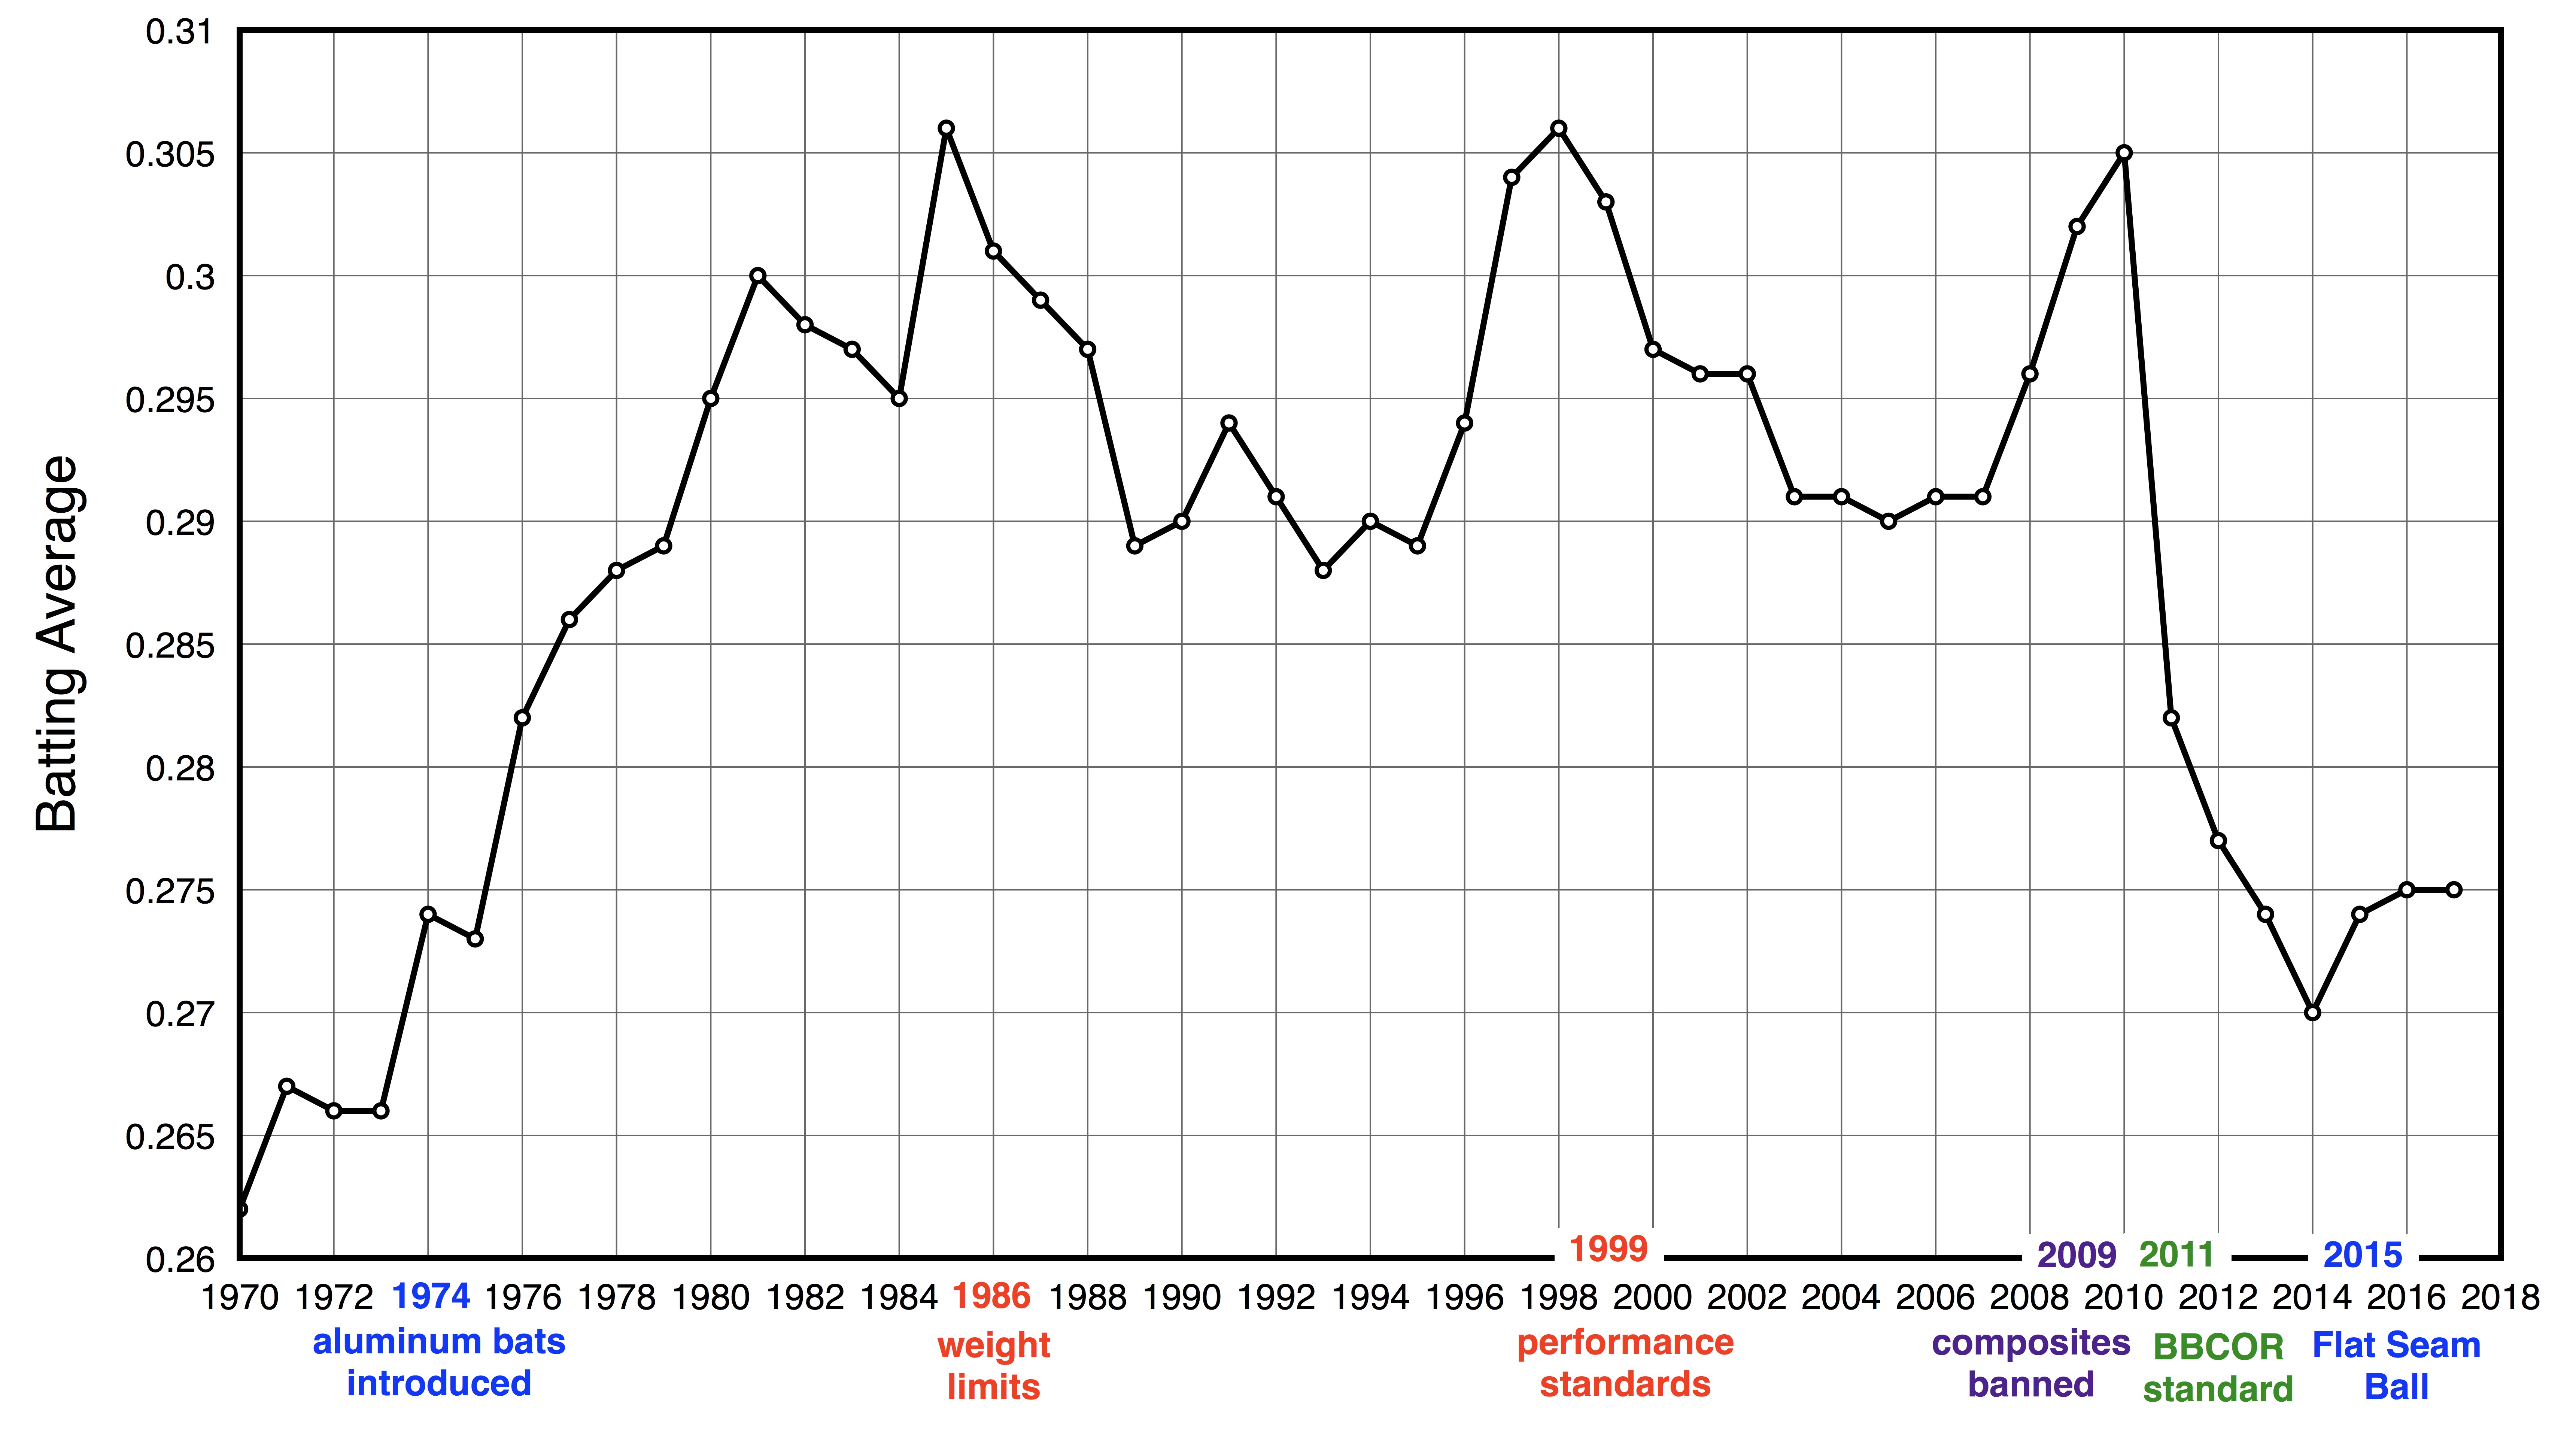
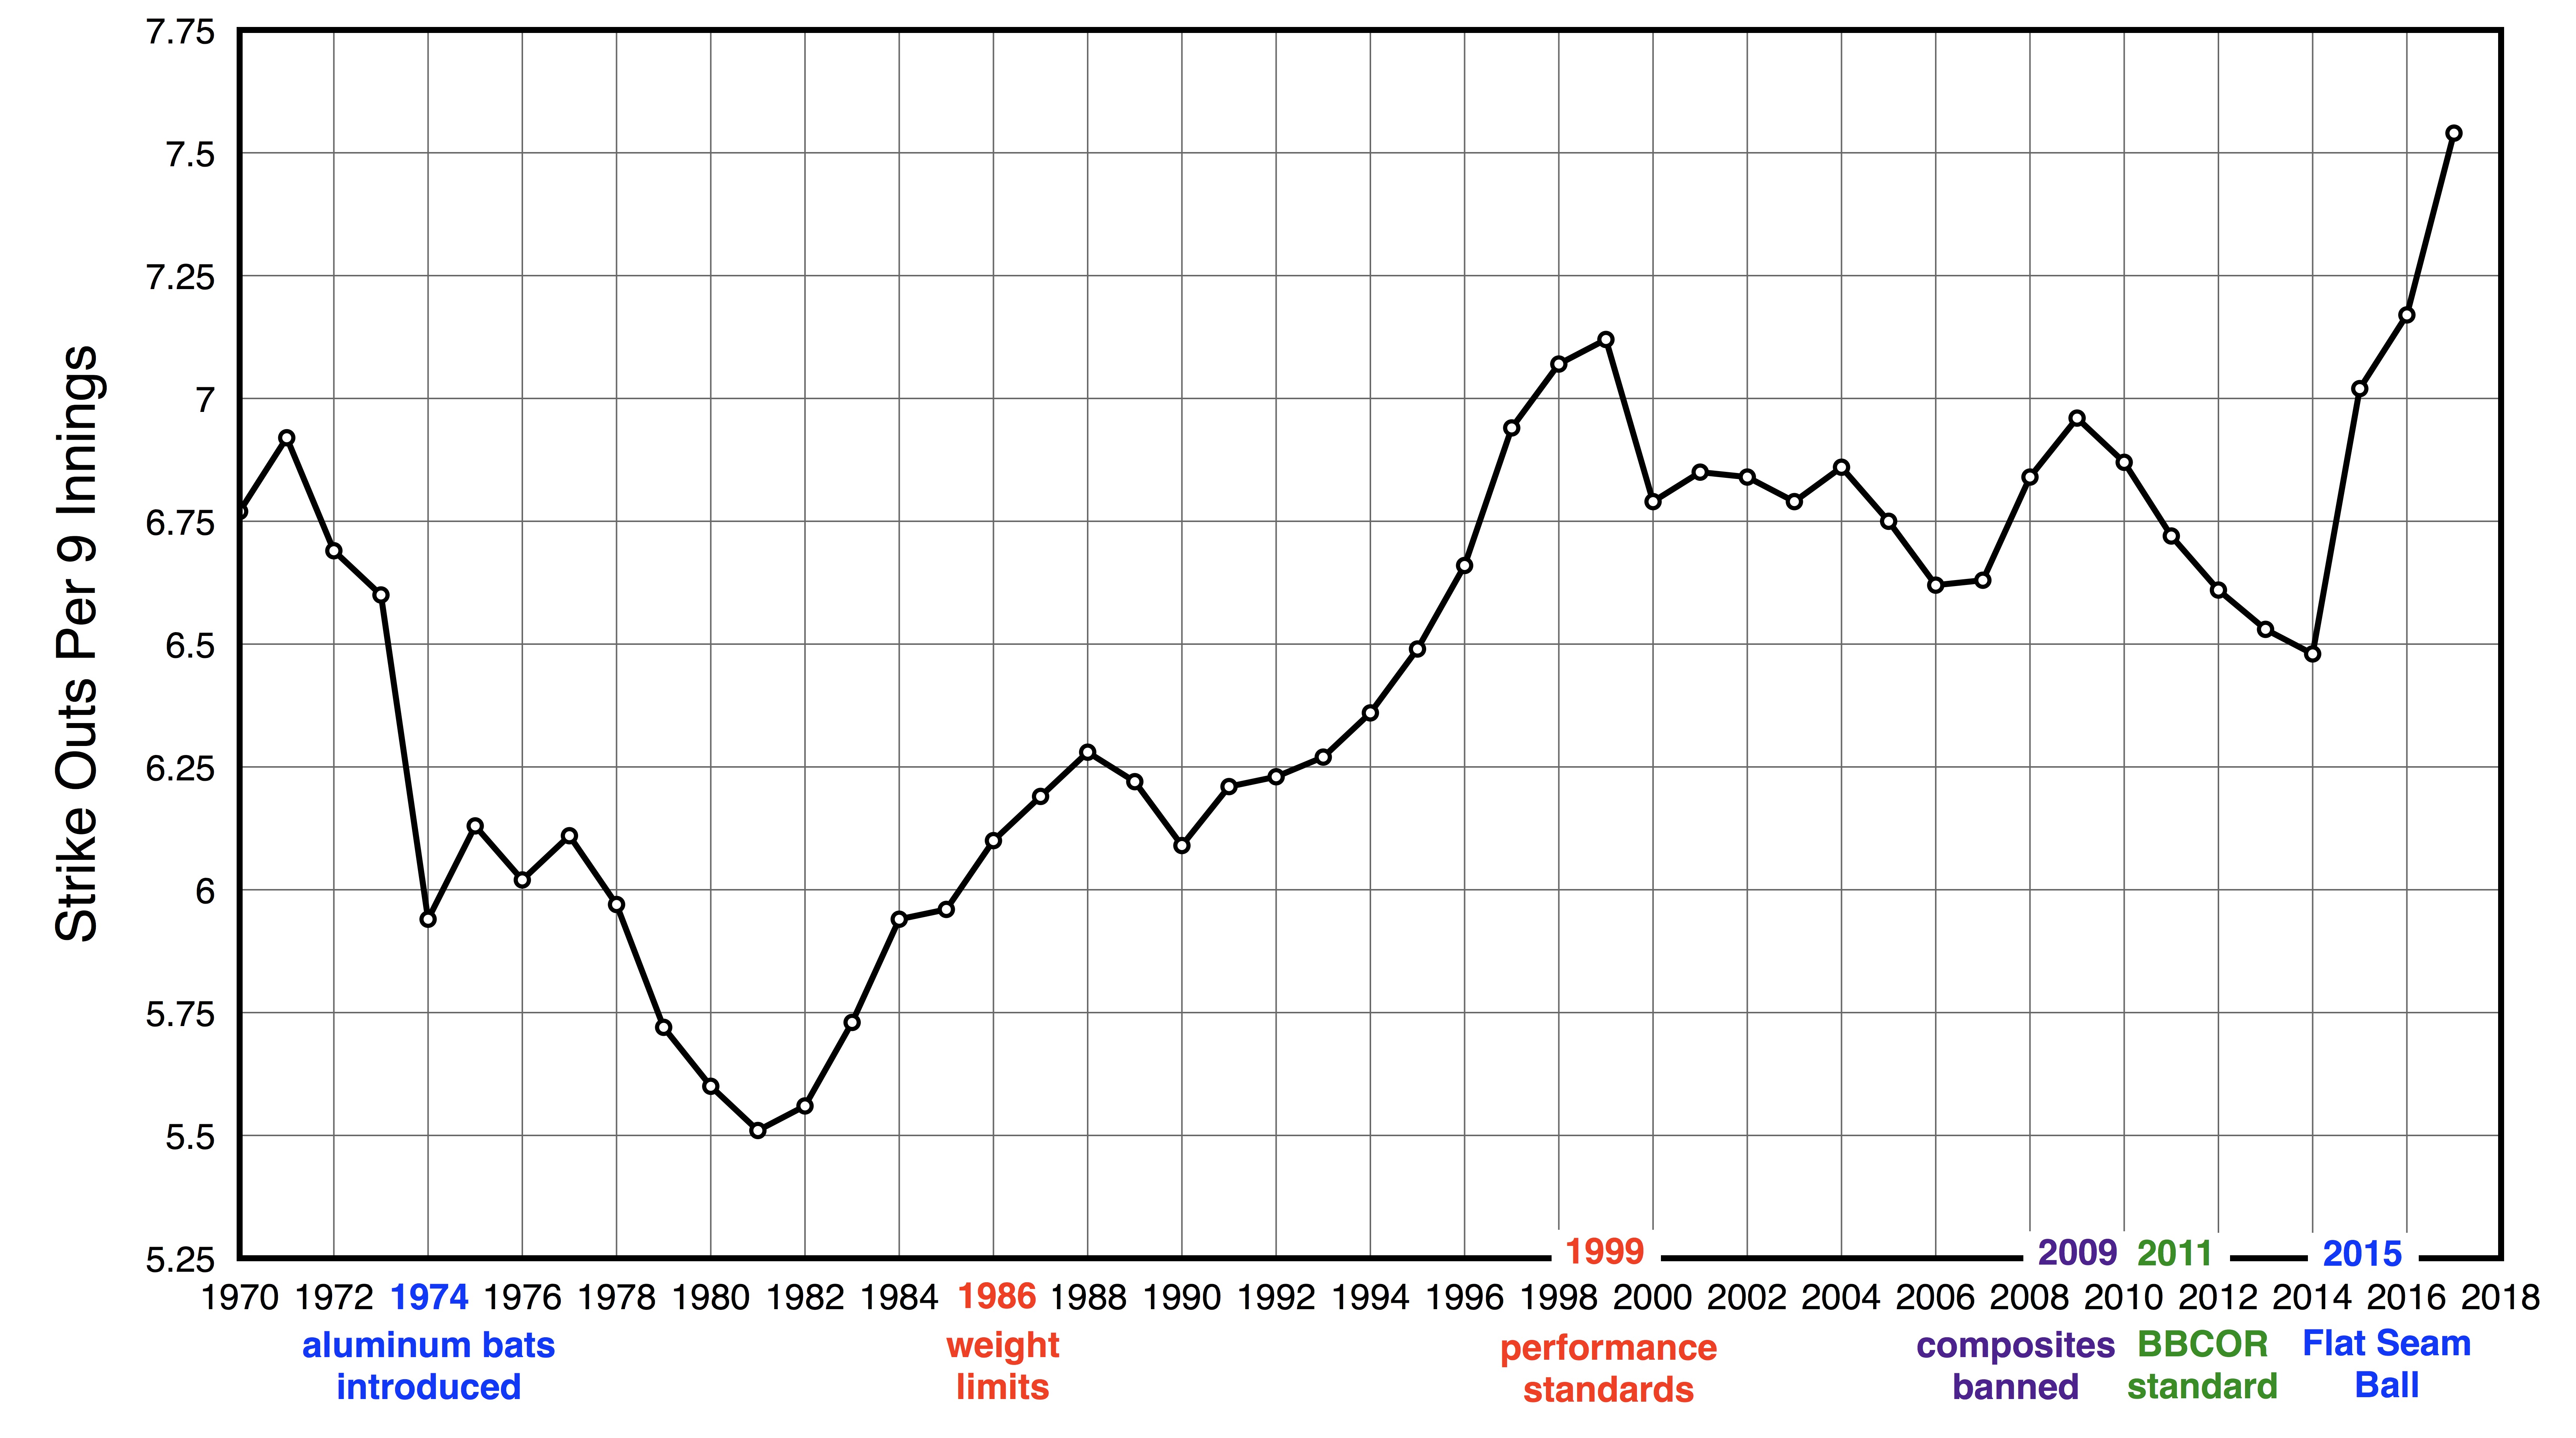
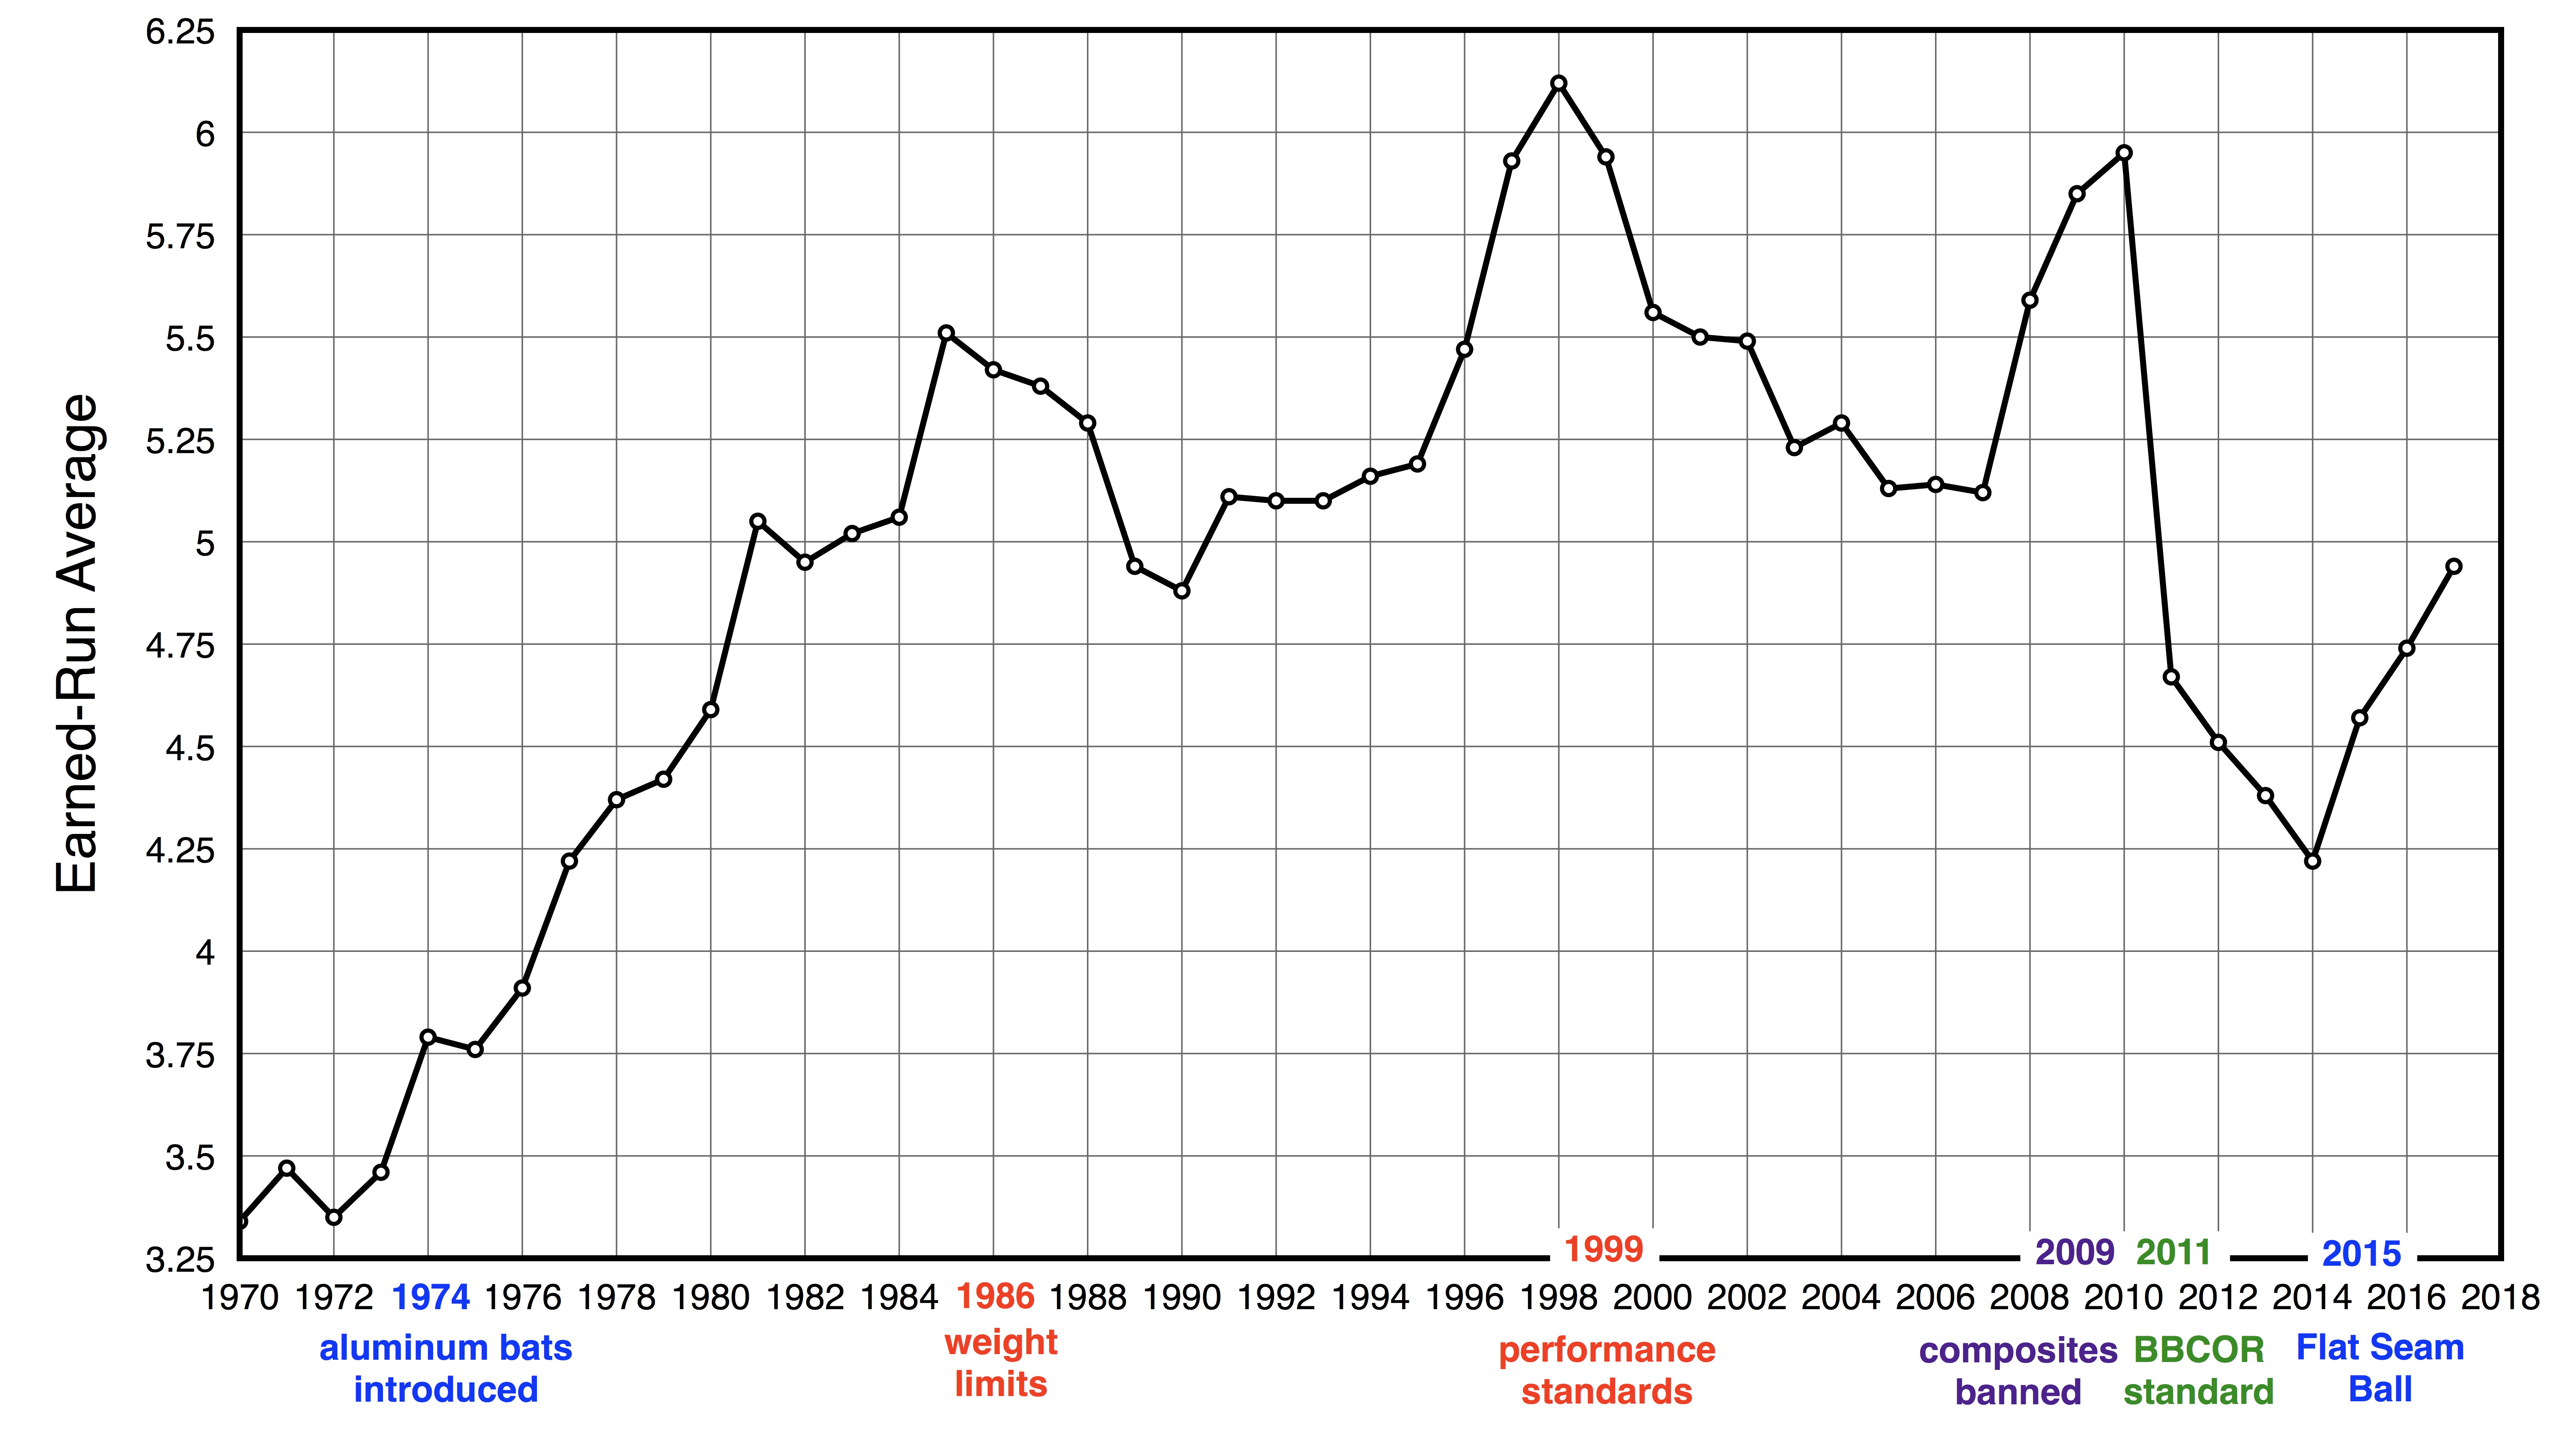
The NCAA publishes a summary of statistical trends for Division 1 College Baseball, which includes yearly results for batting averages, home runs per game, runs scored per game, strikeouts per 9 innings, pitcher earned-run-averages, stolen bases, and fielding percentages.[1] In this article I will display the statistical data graphically and discuss the performance trends aluminum and composite bats as well as identifying the effects of bat performance standards. But, before I discussing the NCAA data trends below, I should highlight several important dates regarding the performance of baseball bats:
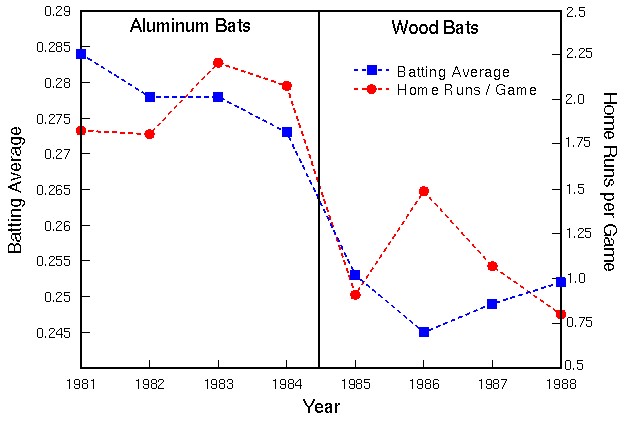
- 1974 - aluminum bats introduced. The aluminum baseball bat was introduced into college baseball in 1974 as an economical answer to rising costs of replacing the large number of wood bats that were being broken during a season. The first aluminum bats were heavy and did not perform much differently than wood bats. However, advances in aluminum alloys enabled the design of single-walled metal bats that soon began to significantly outperform wood bats.
- 1986 - weight limit. Concern about the increase in bat performance and the impact that metal bats were having on the game of baseball, the NCAA imposed a lower limit on the weight of a bat. This wasn't technically a performance standard (batted-ball speeds were neither measured nor regulated) but the fact that hollow aluminum bats can be made significantly lighter in weight than solid wood bats allows for a greater bat-swing speed and better bat control. The NCAA restriction on bat weight did cause bat performance to drop for the next several years.
- 1999 - BESR standard. During the early 1990's several governing bodies and manufacturers had been discussing the regulation of bat performance. After the 1998 season - during which a large number of scoring records were broken - the issue came to a head, and the NCAA adopted the BESR (Ball-Exit-Speed Ratio) standard to regulate the performance of aluminum and composite bats. In addition, the NCAA instituted a reduction of the maximum barrel diameter to 2.5-inches, the "minus-3" rule on weight -- which means that the difference between the weight of the bat (in ounces) and the length (in inches) can be nor no more than 3 integers -- and a lower limit on the bat's moment-of-inertia.
- 2009 - composite bat ban. During the 2009 College World Series the NCAA discovered that a large percentage of BESR approved composite bats were found to significantly exceed the performance standard after being broken in through use. In July 2009, the NCAA imposed an indefinite moratorium banning the use of composite bats.
- 2011 - BBCOR standard. After extensive laboratory testing of a large number wood, metal and composite bats, and based on the scientific evidence and arguments of several researchers including Dr. Alan Nathan and myself, the NCAA abandoned the BESR standard and replaced it with the BBCOR=0.50 standard. This new BBCOR standard effectively requires non-wood bats (metal and composite) to produce batted ball speeds no greater than wood.
- 2015 - Flat Seam Ball. The drastic drop in batting performance (Batting Averages, Scoring, and Home Runs) due to the adoption of the BBCOR bat standard is very evident in the statistical data. In 2015 the NCAA changed the baseball in an attempt to increase scoring. The raised-seam ball that had been the standard for college play was replaced with the flat-seam ball used in MLB.[6] Laboratory testing showed that the drag coefficient for flat-seam balls is 25% lower than raised-seam balls,[7] which means that the flat-seam ball will travel farther when hit.
As I predicted several years ago, the data below shows that the game of college baseball changed significantly after the BBCOR standard was adopted at the beginning of the 2011 season. Batting averages, home runs per game and earned-run averages are currently at the lowest levels they have been in more than 30 years. The BBCOR bat performance standard has returned the game of college baseball to a wood bat game. But, also as expected, the change to the flat-seam ball is allowing well-hit balls to travel farther, and home-runs and runs-scored-per-game are both increasing quickly.