
Absorption and Attenuation of Sound in Air
Overview of Absorption
I intend to write some text explaining the general process of absorption of sound in air (viscous effects, thermal conduction effects, and molecular relaxation processes). But, in the mean time, the interactive plot below works and allows for calculation of the absorption coefficient for sound in air.
As sound waves travel through the air, the amplitude of the sound wave decreases (attenuates) as some of the energy carried by the wave is lost to friction and relaxation processes in the gas (air). There are two main processes by which sound energy is absorbed by air:
- classical absorption --- viscous losses due to friction as molecules (nitrogen, oxygen, argon, carbon dioxide) collide with each other. This thermal-viscous classical absorption depends on the square root of temperature, and the square of the frequency.
- relaxation processes --- the two primary molecules that make up 99% of air are the two diatomic molecules, nitrogen (N2) and oxygen (O2). Some of the energy carried by the sound wave causes these molecules to vibrate and rotate, thus absorbing kinetic energy from the wave. These relaxation processes are different for nitrogen (N2) and oxygen (O2).
NOTE: This plot is a Computable Document Format (CDF) object created by Mathematica and you will need to install the free Wolfram CDF Player to be able to see it and interact with it. Unfortunately, the CDF player is only available for Safari and Firefox on Mac OSX and Firefox and Internet Explorer for Windows. And the CDF player is not yet available for mobile devices.
Here is a link to a standalone version of the absorption calculator (you'll still need to download the Wolfram CDF Player to interact with it, but you won't have to use a web browser. [NOTE: for some reason the slider for pressure starts out at 0.5 atm].
How to Use this Interactive Plot
By moving the three sliders you can adjust the values of:
- relative humidity - from 0 to 100% (increments of 1%),
- frequency - from 10 Hz up to 60 kHz (increments of 5 Hz),
- temperature - from -10oC to 45oC (increments of 1oC).
- pressure - from 0.5 Patm to 1.0 Patm (increments of 0.1 Patm).
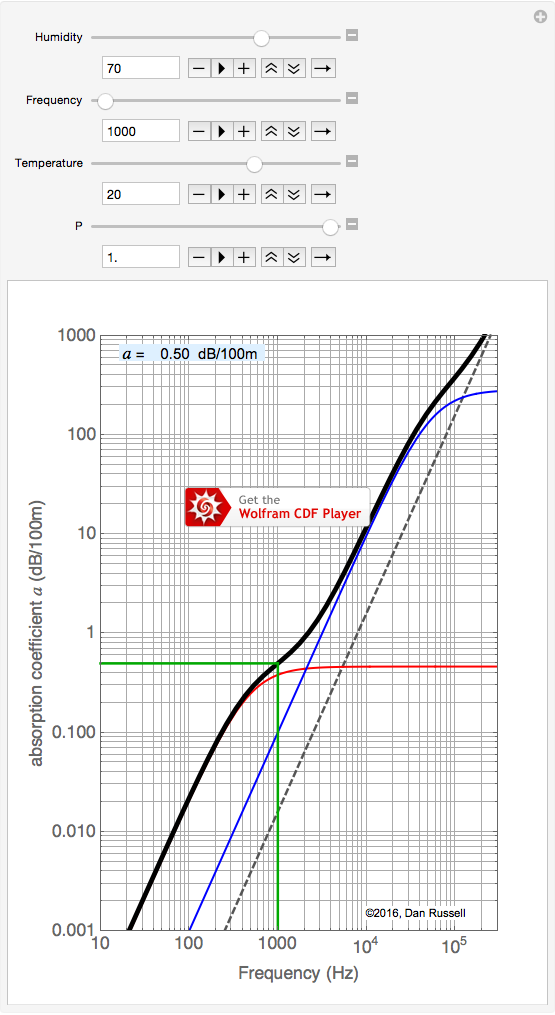
The colored curves on the plot represent the following:
- The black dashed line represents the classical absorption due to viscous and thermal conduction effects. Viscous and thermal conduction absorption are both proportional to the square of frequency, so on a log-log plot the classical absorption looks like a straight line with a slope of 2.
- The Red curve represents the molecular relaxation due to the Nitrogen (N2) molecules that comprise 78% of the air.
- The Blue curve represents the molecular relaxation due to the Oxygen (O2) molecules that comprise 21% of the air.
- The solid Black curve is the sum total of all three absorption mechanisms. This is the attenuation number shown in the blue box at the top left in the plot
- The two Green lines are guides to show the value of absorption (given as a number in the blue box at the upper left of the plot) for a specified frequency (selected via the Frequency slider).
References
- H.E. Bass, L.C. Sutherland, A.J. Zuckerwar, D.T. Blackstock, and D.M. Hester, "Atmospheric absorption of sound: Further developments," J. Acoust. Soc. Am., 97(1), 680-683 (1995).
- ANSI Standard S1-26:1995, "Calculation of the Absorption of Sound by the Atmosphere" (ISO 9613-1:1996).